

I’m forever blowing bubbles,
Pretty bubbles in the air,
They fly so high, nearly reach the sky,
Then like my dreams they fade and die.
A song written in 1919 in the states and made famous in the music halls of Britain in the 1920’s. Football fans will instantly relate the tune to West Ham United however the song could have also been adopted by the UK press when discussing the housing market cycles.
When will it happen, how will it happen, it is bound to happen. Some pray for it (first time buyers) Some seem to bet on it on an annual basis (some members of the property press) and some are looking to take advantage of it happening (speculators / investors).
So where are we in the cycle of housing bubbles, is the bubble rising, fading or ready to burst?
Are there more cash buyers in the market?
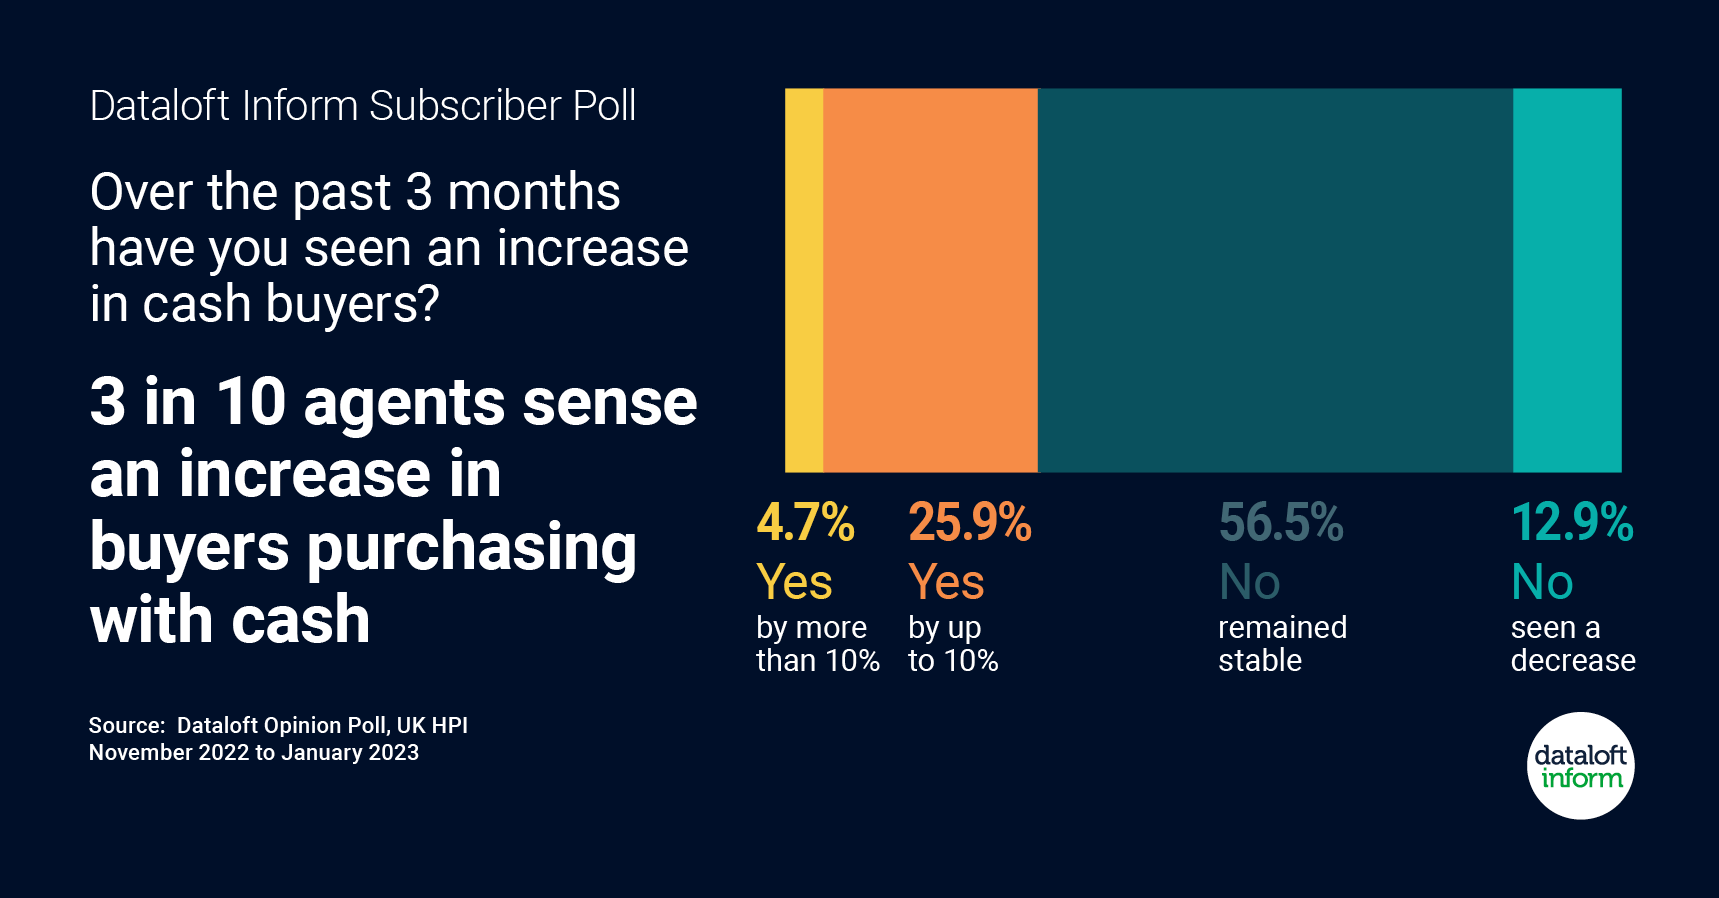
- 30% of agents sense there has been an increase in cash buyers between November and January, according to the results of the Dataloft Opinion Poll.
- Over half (55%) of agents sense cash buyer numbers have remained stable, while 15% believe they have decreased. This follows the fall-out across the market following the mini-budget and the significant rise in mortgage rates.
- Across England and Wales, 27% of sales recorded in the first nine months of 2022 were cash purchases, in six Local Authorities the proportion was over half.
- Research by Hamptons suggests around 40% of sales in January 2023 were in cash, up from 29% in January 2021 and 2022, suggesting purchasing property with cash may well be on the rise. Source: Dataloft Opinion Poll, UK HPI
BUBBLE ANALYSIS: Mixed. There were differing views on the number of cash buyers in the market. The vast majority of the agents felt that there was no change in the number of cash buyers, but 25.9% believed there was an increase of up to 10%. This increase could be attributed to premium London agents primarily dealing with cash buyers or to an uptick in investors, both from within the U.K. and overseas, likely spurred by the devaluation of the pound observed in 2023.
Mortgage arrears low and little appetite for repossessions.
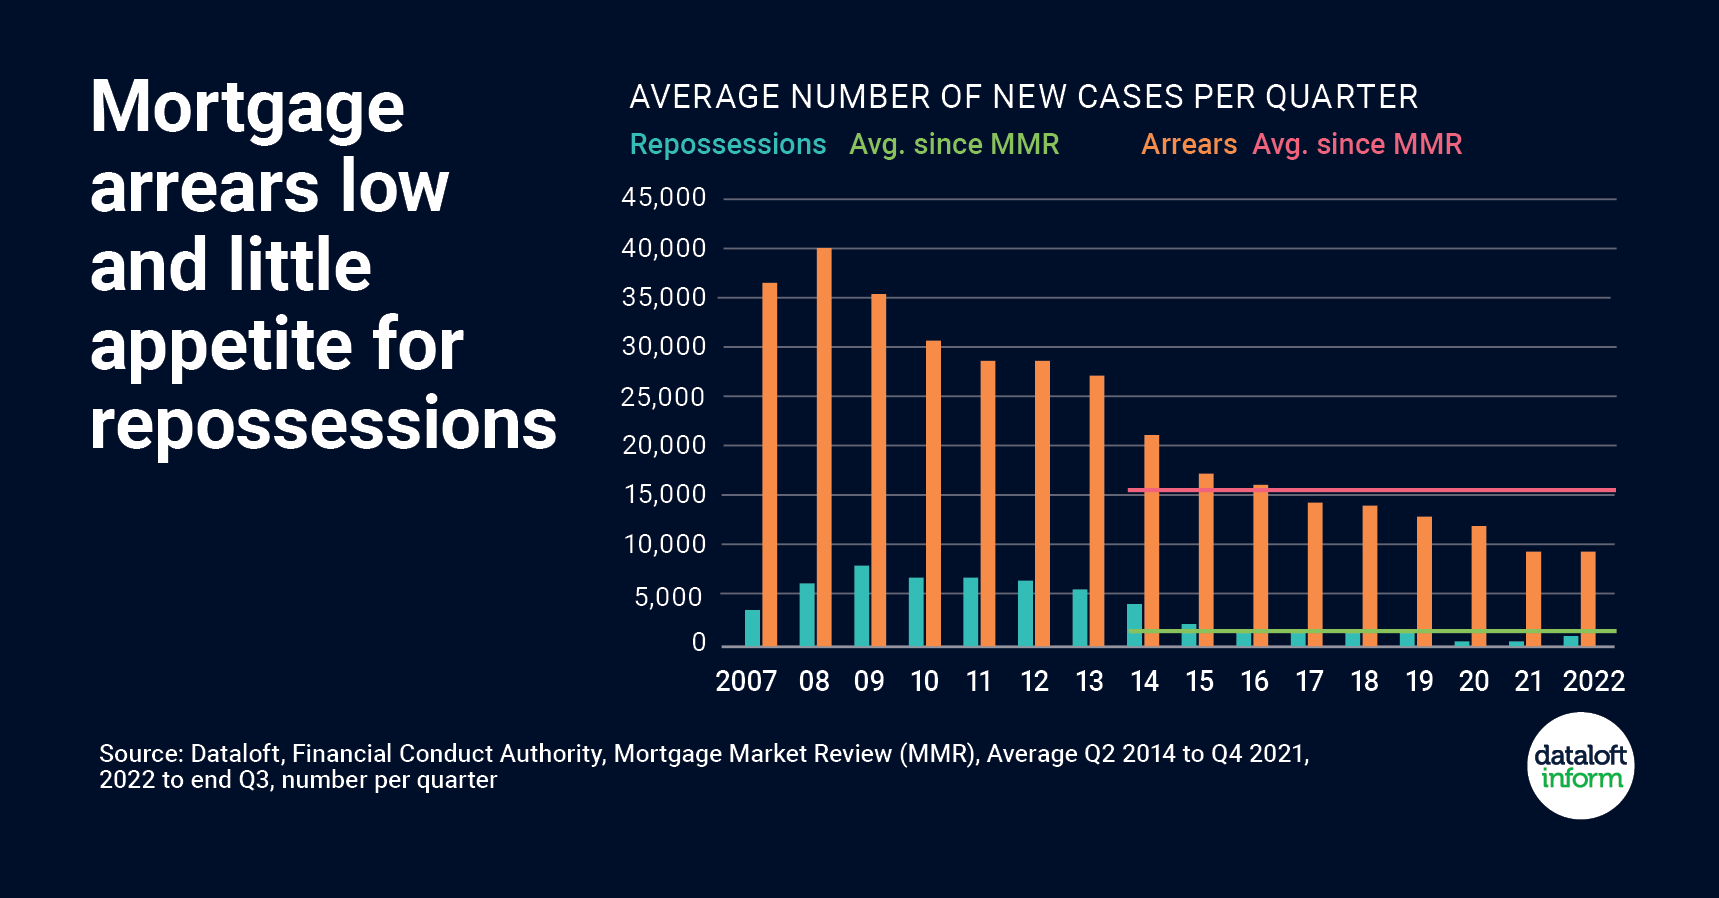
- Mortgage rates have hit the headlines for the last 5 months but rates of arrears remain low by long-term standards. Just 0.88% of all mortgages are in arrears of 1.5% or more, according to the latest data from the Financial Conduct Authority (FCA).
- At the height of the Global Financial Crisis there were more than 40,000 new arrears cases each quarter, the average since the implementation of the Mortgage Market Review in April 2014 just over 15,000. At the end of Q3 2022 the figure was just over 10,000.
- Likewise, repossession numbers are far lower. Repossessions breached 8,500 in the first quarter of 2009, have averaged just below 1,800 since the MMR with the figure in 2022 was just over 1,000.
- Swap rates, which rose considerably in the wake of the Growth Plan, continue to pare back, indicating longer-term stability in the market. Mortgage rates are anticipated to stabilise around 4%.Source: Dataloft, Financial Conduct Authority, Mortgage Market Review (MMR), Average Q2 2014 to Q4 2021, 2022 to end Q3, number per quarter
BUBBLE ANALYSIS: Going down. In February, the Bank of England base rate was forecasted to rise to 4% during the year. However, we have witnessed the rate surpassing this figure in the second half of the year, reaching 5.25%. This increase has placed added pressure on households with mortgages. As reported in The Times on September 13, 2023, mortgage arrears balances have surged by 28.8% over the three months leading up to the end of June, totalling £16.9 billion. With the Bank of England suggesting that rates will remain elevated, we might see a rise in repossessions as we enter the beginning of 2024.
The ongoing relationship between mortgage approvals and sales volumes.
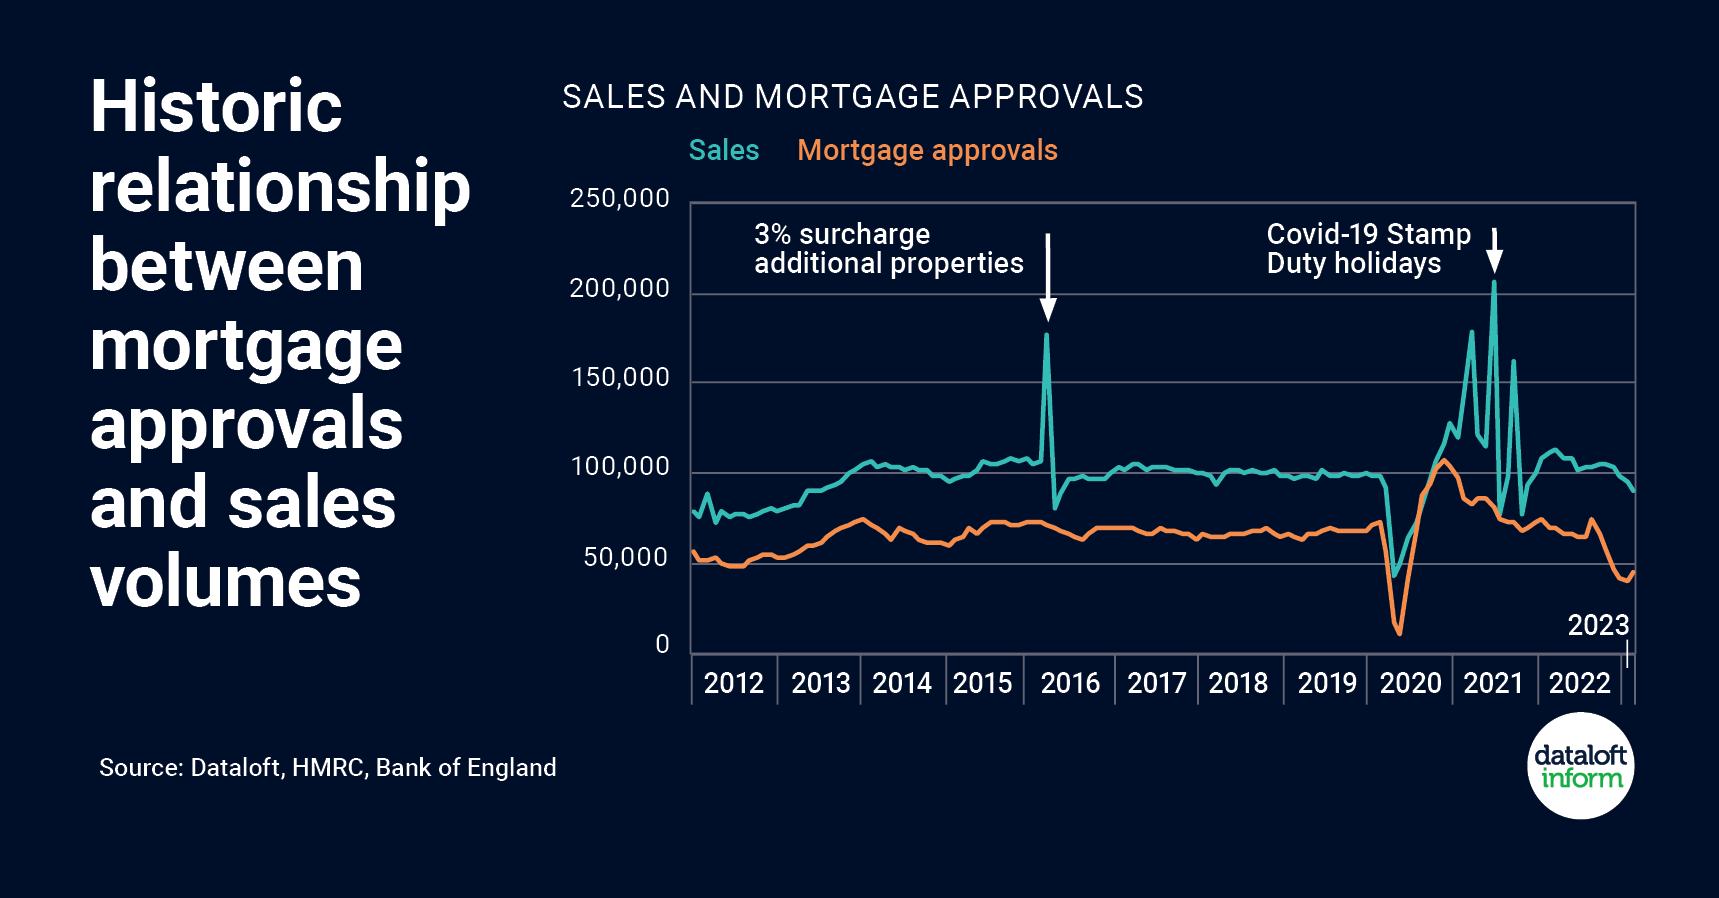
- Official data indicates sales volumes in February were 4% lower than January, while mortgage approvals for the month were 10% higher, the most significant uptick at this time of year since 2011.
- In the 5 years prior to the pandemic, mortgage approvals in February were on average 1.2% lower than in January. With mortgage approvals considered a forerunner of housing market activity, demand in the sales market is likely to rise over the spring.
- The mortgage market is stablising. The decision by the Bank of England to raise the base rate of interest to 4.25% was largely expected and there has been little movement in long-term swap rates since the announcement.
- Spikes in sales volumes in recent times have historically been linked to government changes to property taxation. The impact of changes in 2016 and 2021 is clearly visible.
- In the last decade peaks in the sales market have been associated with changes to property taxation including the 3% surcharge on additional homes in 2016 and the Stamp Duty Holiday in 2021. Source: Dataloft, HMRC, Bank of England
BUBBLE ANALYSIS: Going down: Unsurprisingly the relationship between mortgage approvals and the volume of sales have always been linked. Mortgage approvals have improved since the beginning of 2023 but still remain slightly below typical levels. In the year up to July, approvals averaged 51,600 per month, which is 21% lower than the average for the seven years preceding the pandemic. Demand for homes is 34% lower than the average for the same period in the last five years (according to Hometrack).
Are people still working from home?
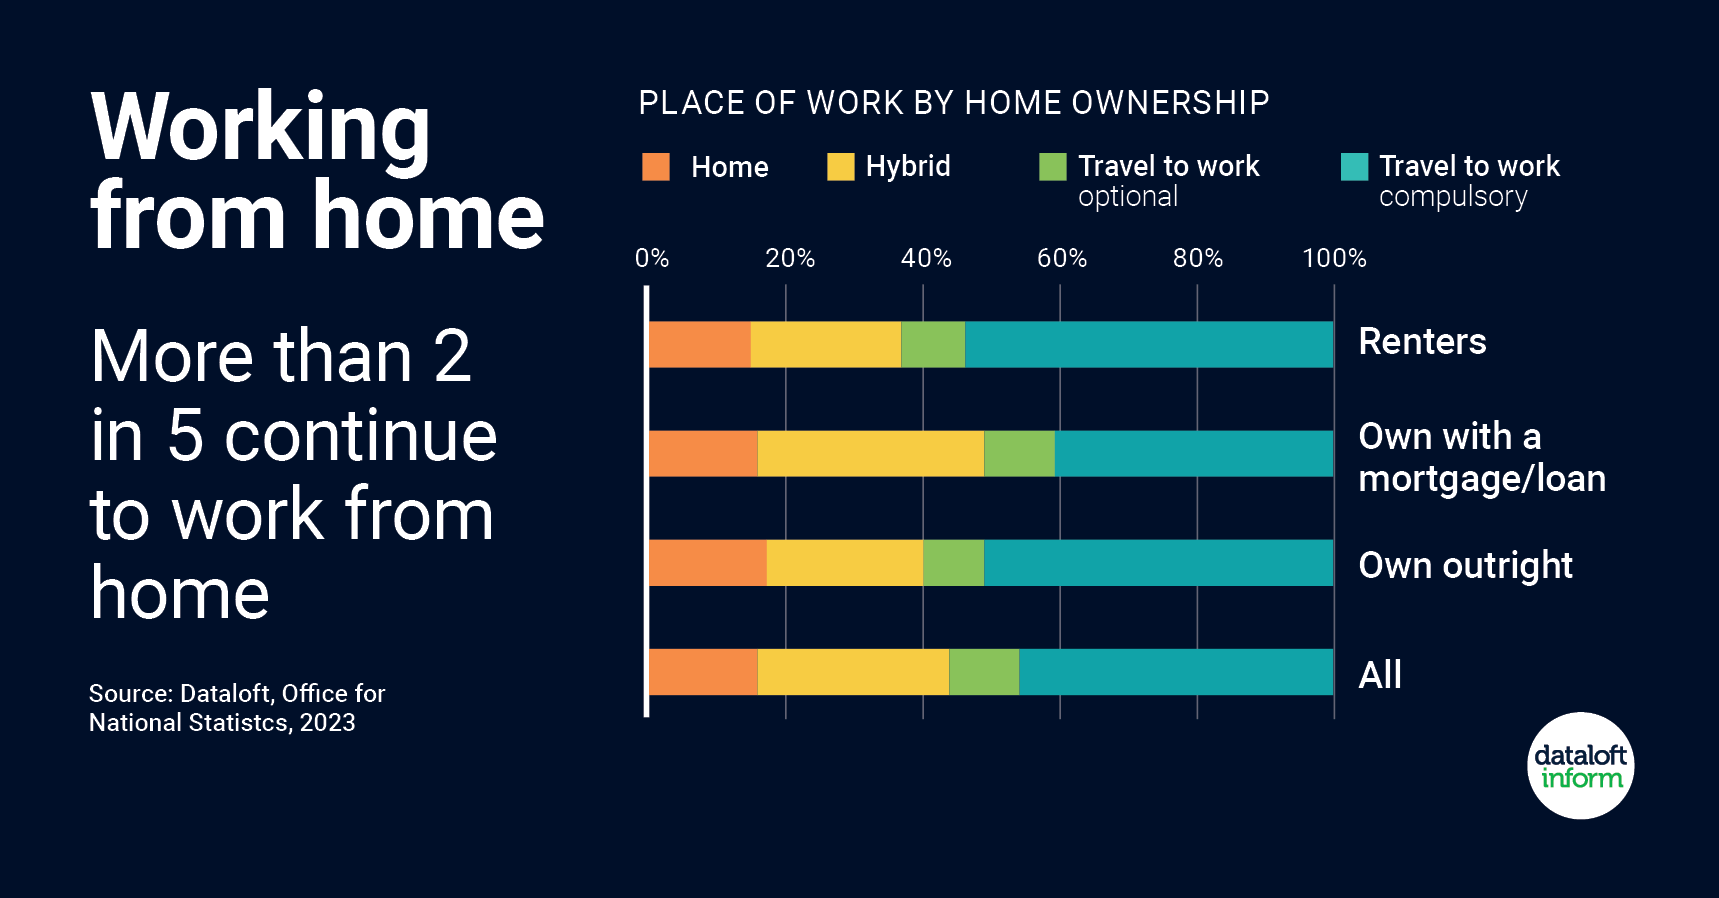
- 44% of people continue to work from home, either full time or on a hybrid basis, according to the latest data released by the Office for National Statistics.
- Home or hybrid working is more prevalent for home owners than renters, for the self-employed and for those with dependent children.
- A survey of over 12,000 renters found over half of renters would be encouraged to choose quicker or rent for longer, and one in six would be willing to pay more, if a property was furnished to support home working (Dataloft, Property Academy Renter Survey, 2022).
- The move to hybrid working has been a significant societal shift as a result of the Covid-19 pandemic. Source: Dataloft, Office for National Statistcs, 2023
BUBBLE ANALYSIS: Mixed: Covid-19 brought about a significant change in the way people work. They were no longer required to be in the office every day but could now work from home. Consequently, this meant people could move and live in different parts of the country without losing their jobs. This chart shows that, in general, people are continuing with this style of working even though major companies are requiring employees to be present in their office environments 2 to 3 times per week. This does mean we are witnessing an exodus of buyers who previously worked in London. However, they still feel confident about putting down roots in many different towns and cities around the UK.
What is happening to property prices?
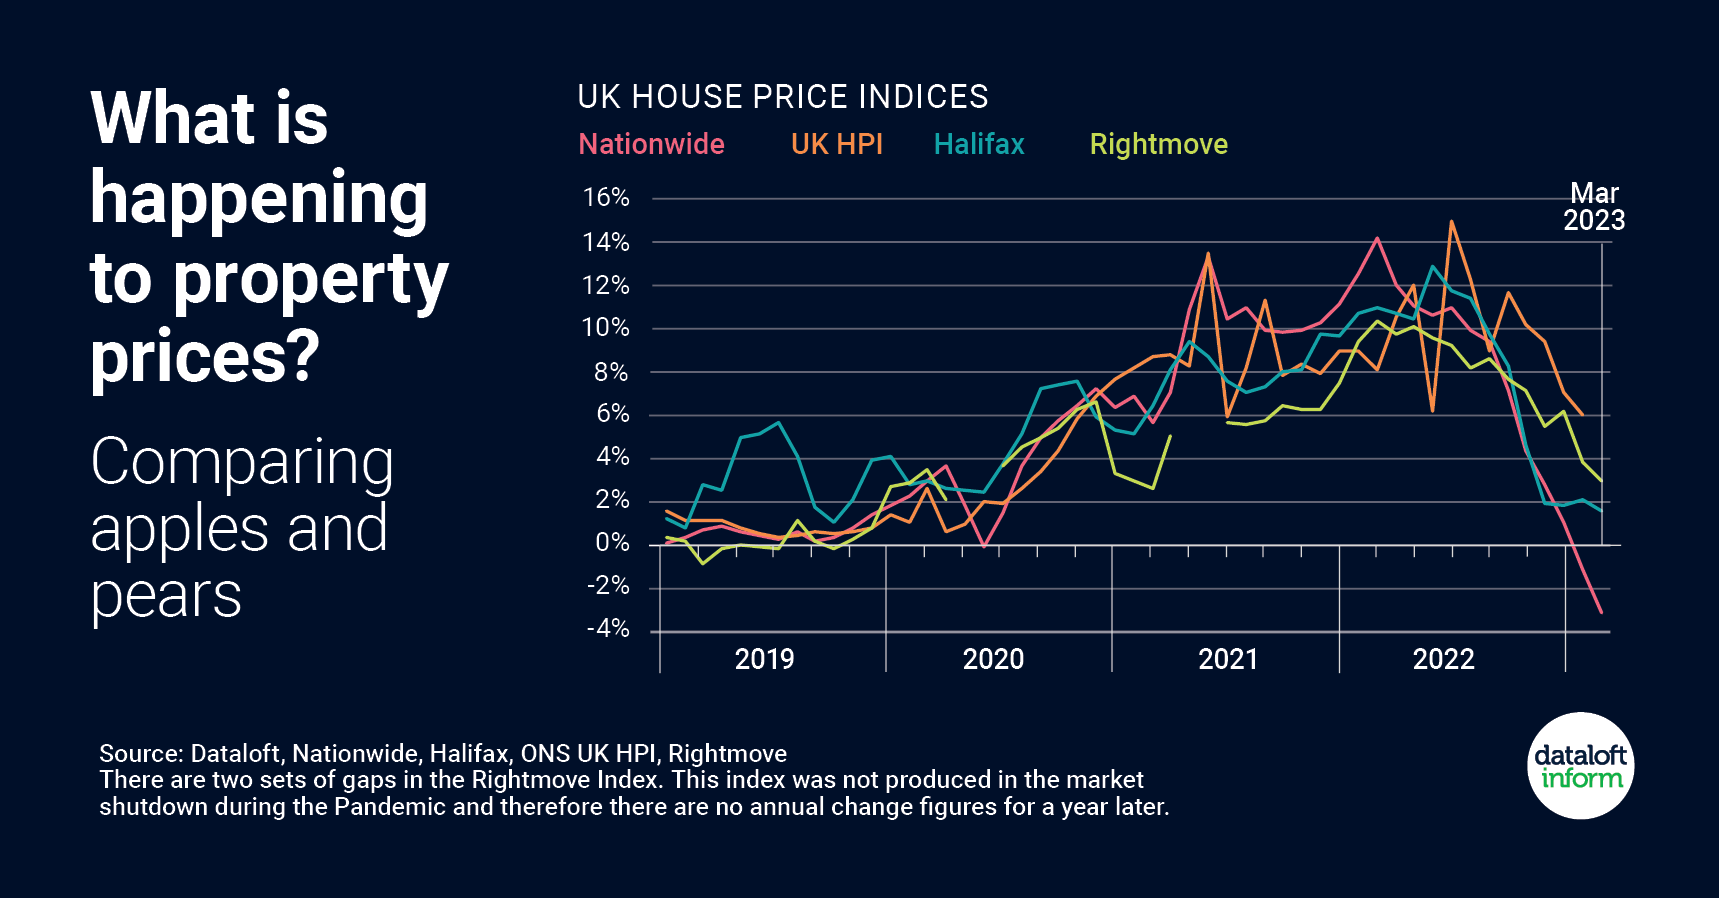
Apples and Pears
- Average UK property prices and annual price growth are published by various organisations. However, the figures are different for each and can cause confusion. This is because the data is calculated in slightly different ways.
- Rightmove average prices are the highest, but their index is based on the asking prices of newly listed properties (around 100,000 each month), not on sales prices. In comparison, the ONS UK HPI index uses final sales prices, including for cash and mortgage sales, recorded by the Land Registry. It includes around 80,000-100,000 sales per month.
- Halifax and Nationwide use their own mortgage applications at approval stage (around 12,000-15,000 per month). The average price quoted by Nationwide is usually the lowest. The differences in the source of the data, as well as the statistical calculations that make up each index, explains their variations.
- Comparing the indexes against each other is like comparing apples with pears. However, despite the variation in methodologies, the overall trend direction noted by each organisation is similar. It is this overall trend which is important when considering what is happening in the current market. Source: Dataloft, Nationwide, Halifax, ONS UK HPI, Rightmove
BUBBLE ANALYSIS: Going down: Due to the different indices using various ways of measuring property prices, the organisations featured in this chart have all come to slightly different conclusions. The one thing they do agree on is that the price trend is falling. We can see this in the current market with many properties reducing there prices before they receive viewings or offers. According to Savills’ research, they anticipate a reduction in residential property prices of between 9% and 11% locally by the end of 2023.
What about mortgage rates?
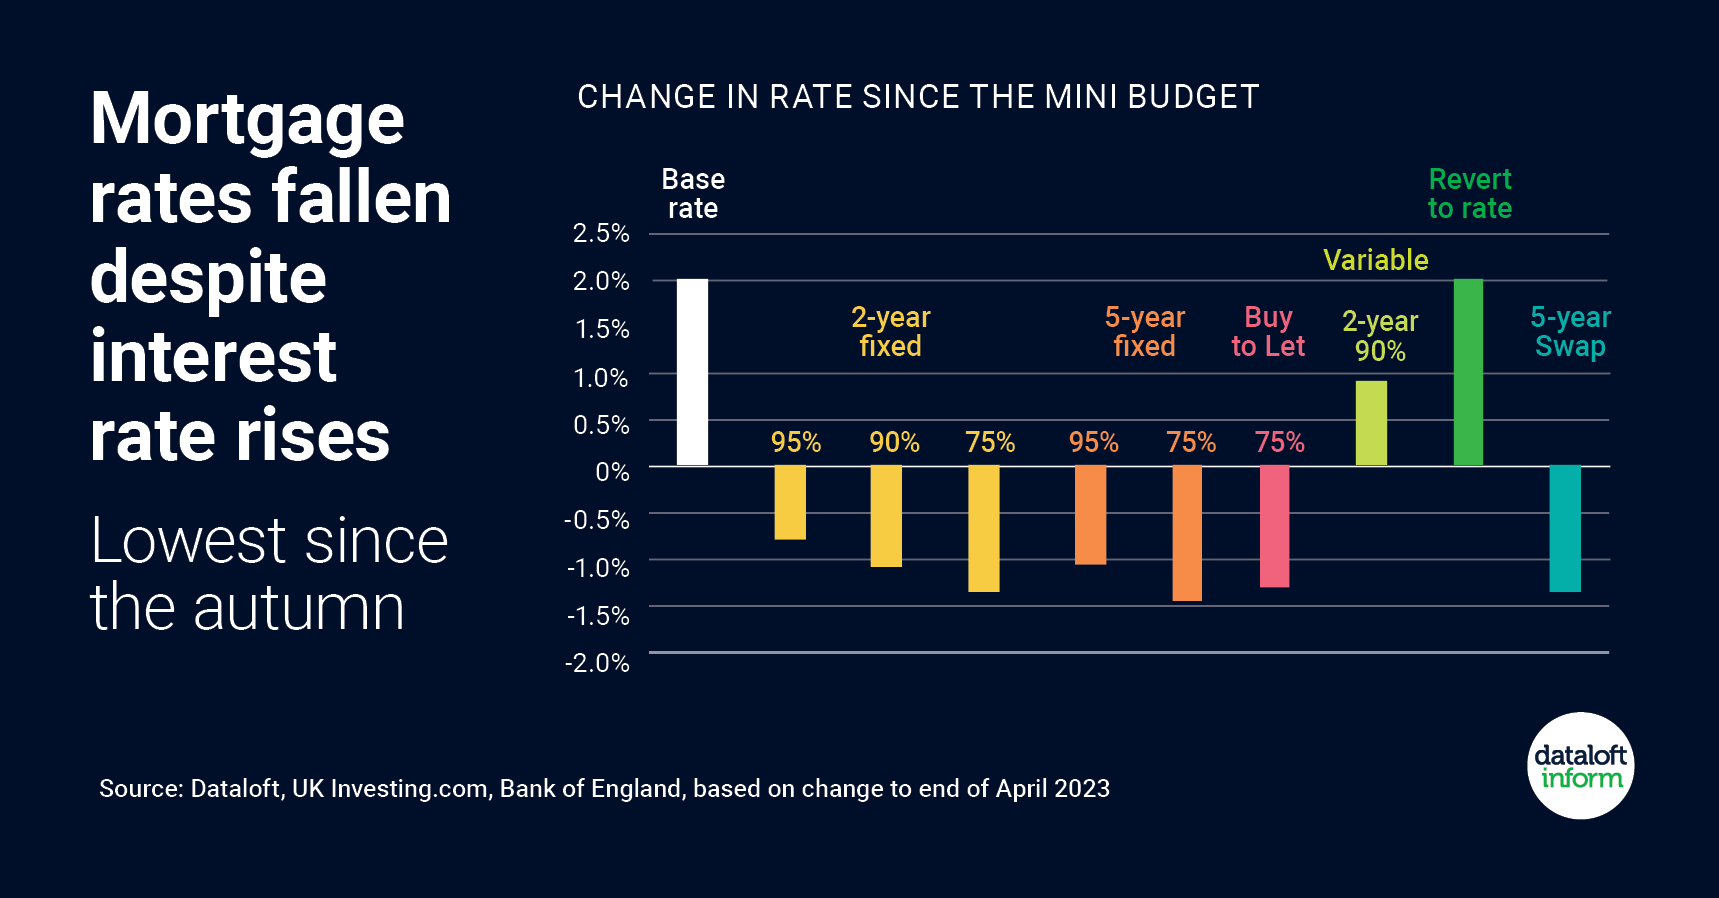
- Analysis of mortgage interest rates in recent times shows that while the base rate of interest has risen, mortgage rates for those seeking to purchase have fallen back from their autumn peak.
- Average fixed rate mortgage rates had fallen back to their lowest since the Autumn prior to the announcement by the Bank of England to raise the base rate to 4.5%.
- Product choice in the market has also increased in recent months across the Loan-to-Value spectrum, providing more choice for prospective purchasers. Lower LTV ratios have benefitted the most from rate declines.
- While the base rate rise will impact those on tracker or variable rate mortgages, the majority of mortgage loans agreed continue to be on a fixed term basis. Source: Dataloft, UK Investing.com, Bank of England, based on change to end of April 2023
BUBBLE ANALYSIS: Going down: In May and June we saw mortgage rates come down slightly despite the continued rising level of interest rates. Lenders continue to align their variable rates with the Bank of England (BOE) rate hikes while adjusting their fixed rates in line with swap rates and long-term debt interest payments. This means that, at times, we are observing lender rates decrease even as the BOE rate increases. Even though we see these adjustments take place weekly, there does not seem to be light at the end of the 2023 tunnel where we may see what would be deemed affordable mortgage deals become available to the normal house buyer.
Taking a look at the housing supply over the past ten years.
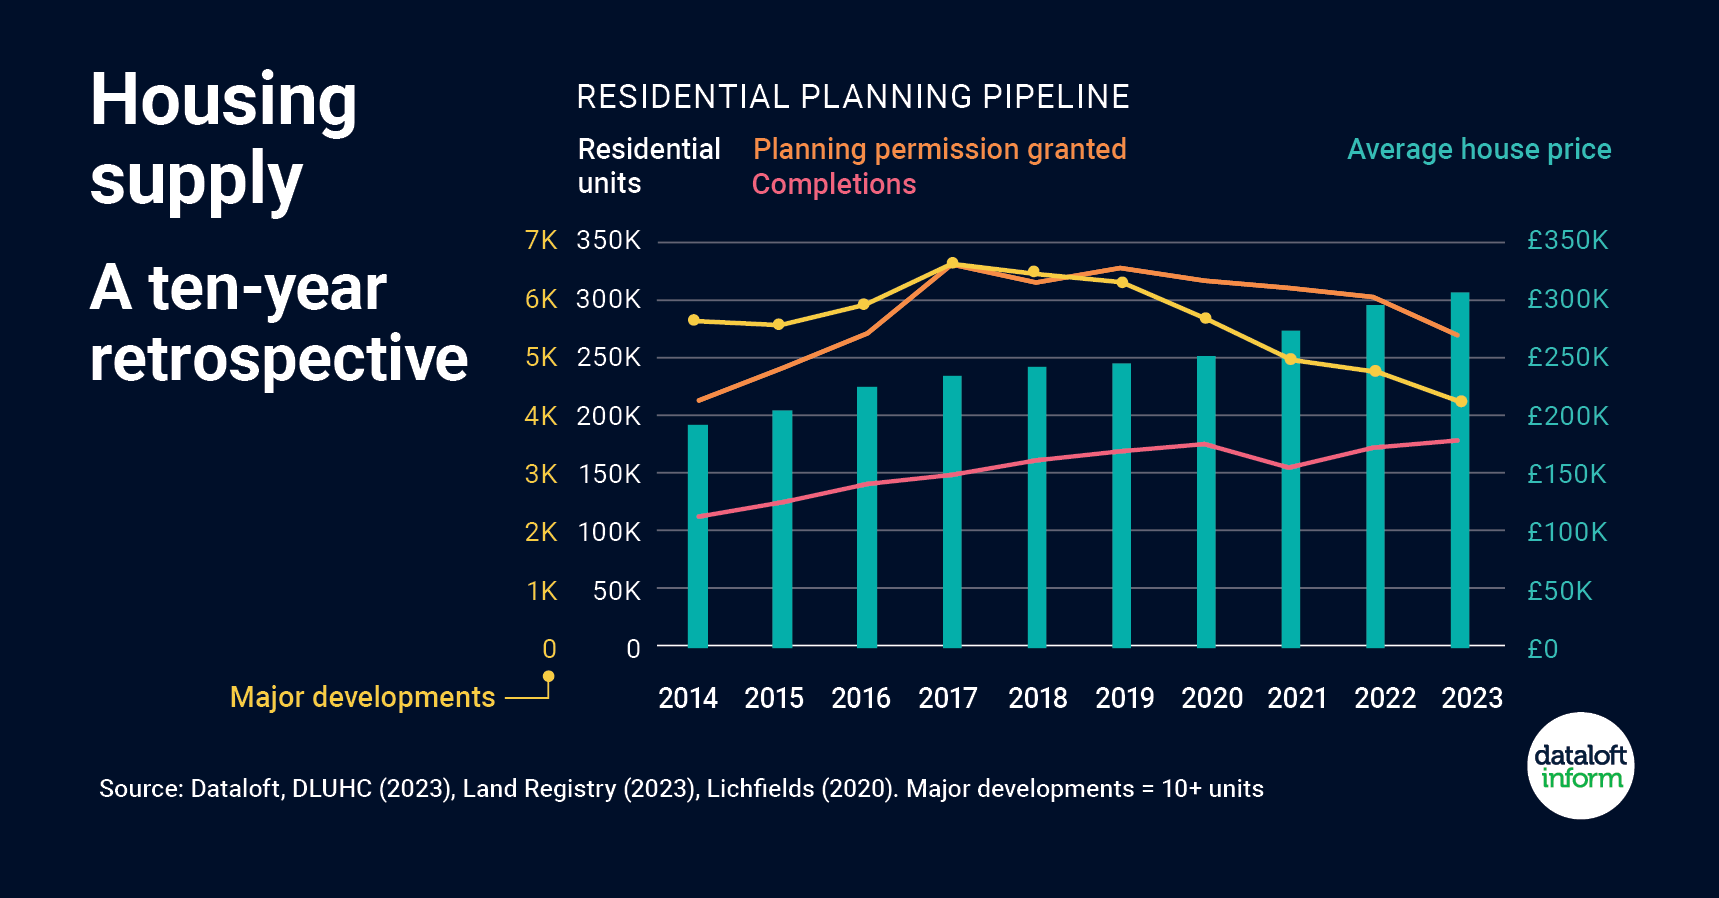
- Recently-released statistics on planning applications show a steady decline in major residential approvals across the country since the peak of 6,617 back in 2017. We now sit at 4,221 major residential approvals, the lowest in 10 years.
- On a more positive note, the number of new homes is at a 10-year high with over 177,000 completed in the last 12 months, indicating that we’re still benefitting from the peak of residential approvals between 2017–19.
- Research by Lichfields in 2020 found that developments of over 500 homes can take an average of 3 years to begin completions, with schemes of 200+ homes taking 8.4 years. This means we will still be benefitting from the 2017–19 peak in the immediate future.
- Over the last 10 years average house prices have steadily risen, seemingly unaffected by the residential planning pipeline for the time being. Source: Dataloft, DLUHC (2023), Land Registry (2023), Lichfields (2020)
BUBBLE ANALYSIS: Mixed. Compared to to the previous few years, we can see from the chart that there’s been an increase in the amount of housing being built (completions) by major builders however, this is likely to decrease through 2023/2024. The slowing build rate of new homes will mean that there is a decrease of homes available for sale which in turn will increase the average price of a new build property and prop-up / support the average house price in the UK.
Realistic pricing is essential!
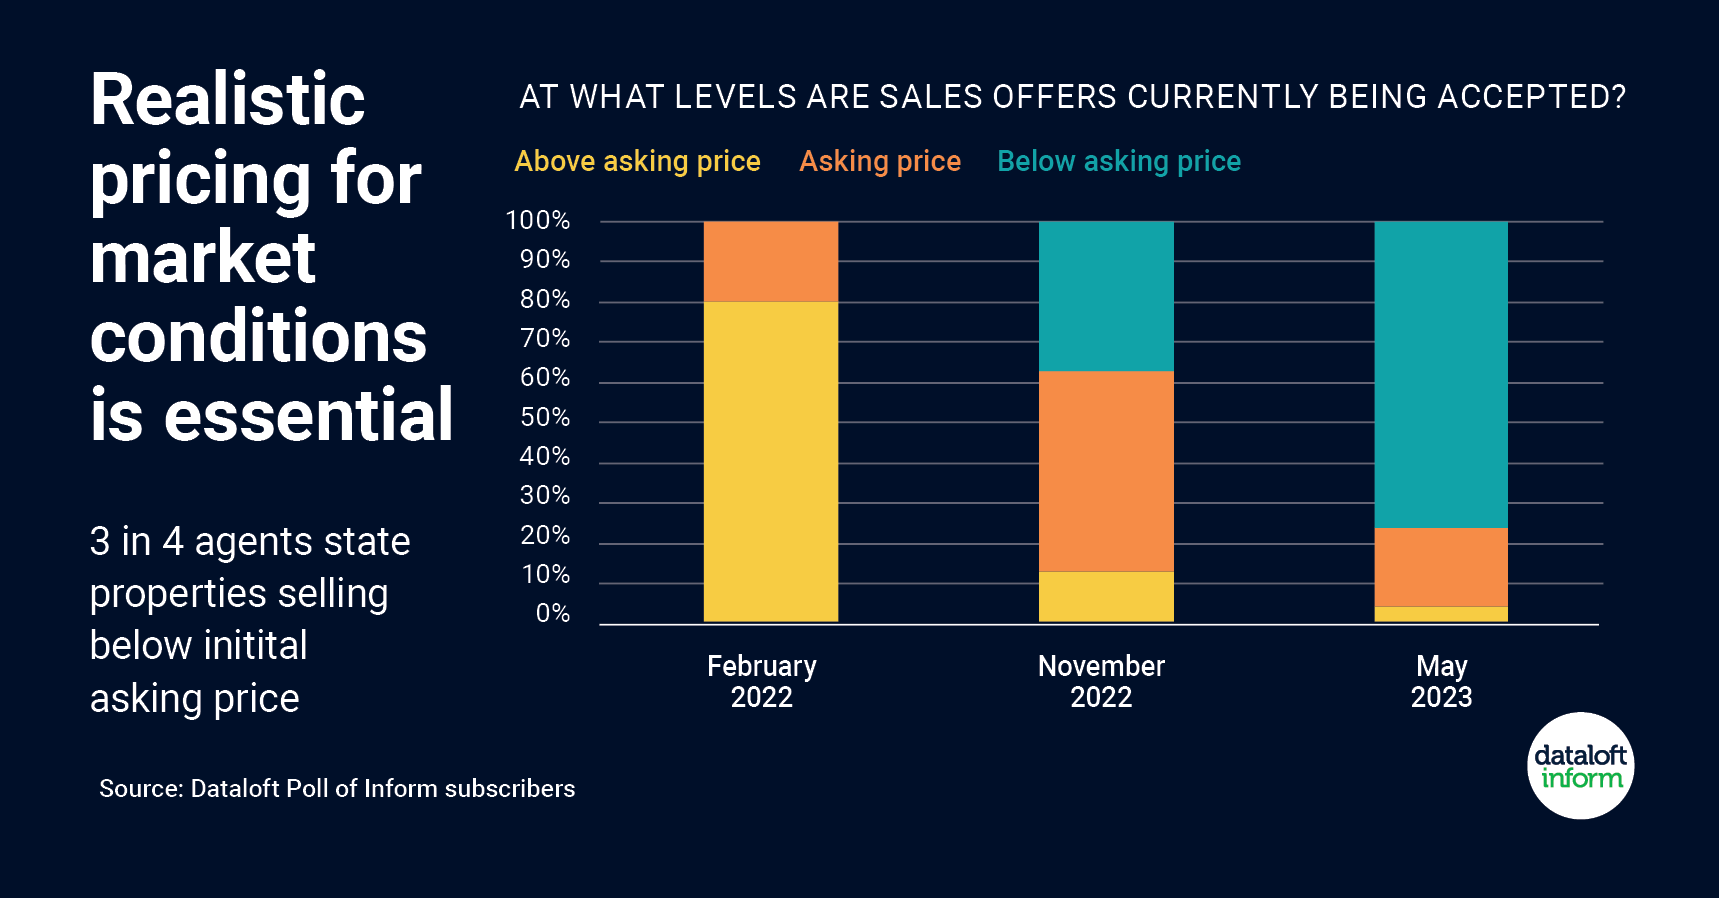
- More than 75% of agents state that properties are selling at a reduction on the initial asking price according to the latest poll of Dataloft Inform subscribers.
- With property price growth softening, realistic pricing is paramount to sales success, with many vendors seemingly overly optimistic in current market conditions. Rightmove reported the average asking price of a newly listed property rose by 1.8% between April and May.
- More than 50% of agents state that properties are, on average, selling with a price reduction of up to 5% on the initial purchase price, while 23% indicate reductions are more substantial.
- Back in November, half of all agents stated properties were selling at asking price, compared to February 2022 where many were selling above asking price. Source: #Dataloft Poll of Inform subscribers
BUBBLE ANALYSIS: Going down. As of 14th September, we saw 203 price reductions during the month in the Greater Peterborough area and over 2000 homes for sale that have been on the market for more than 12 weeks. The market has definitely changed from a sellers market in 2022 to a buyers market in 2023.
Interest Rates:
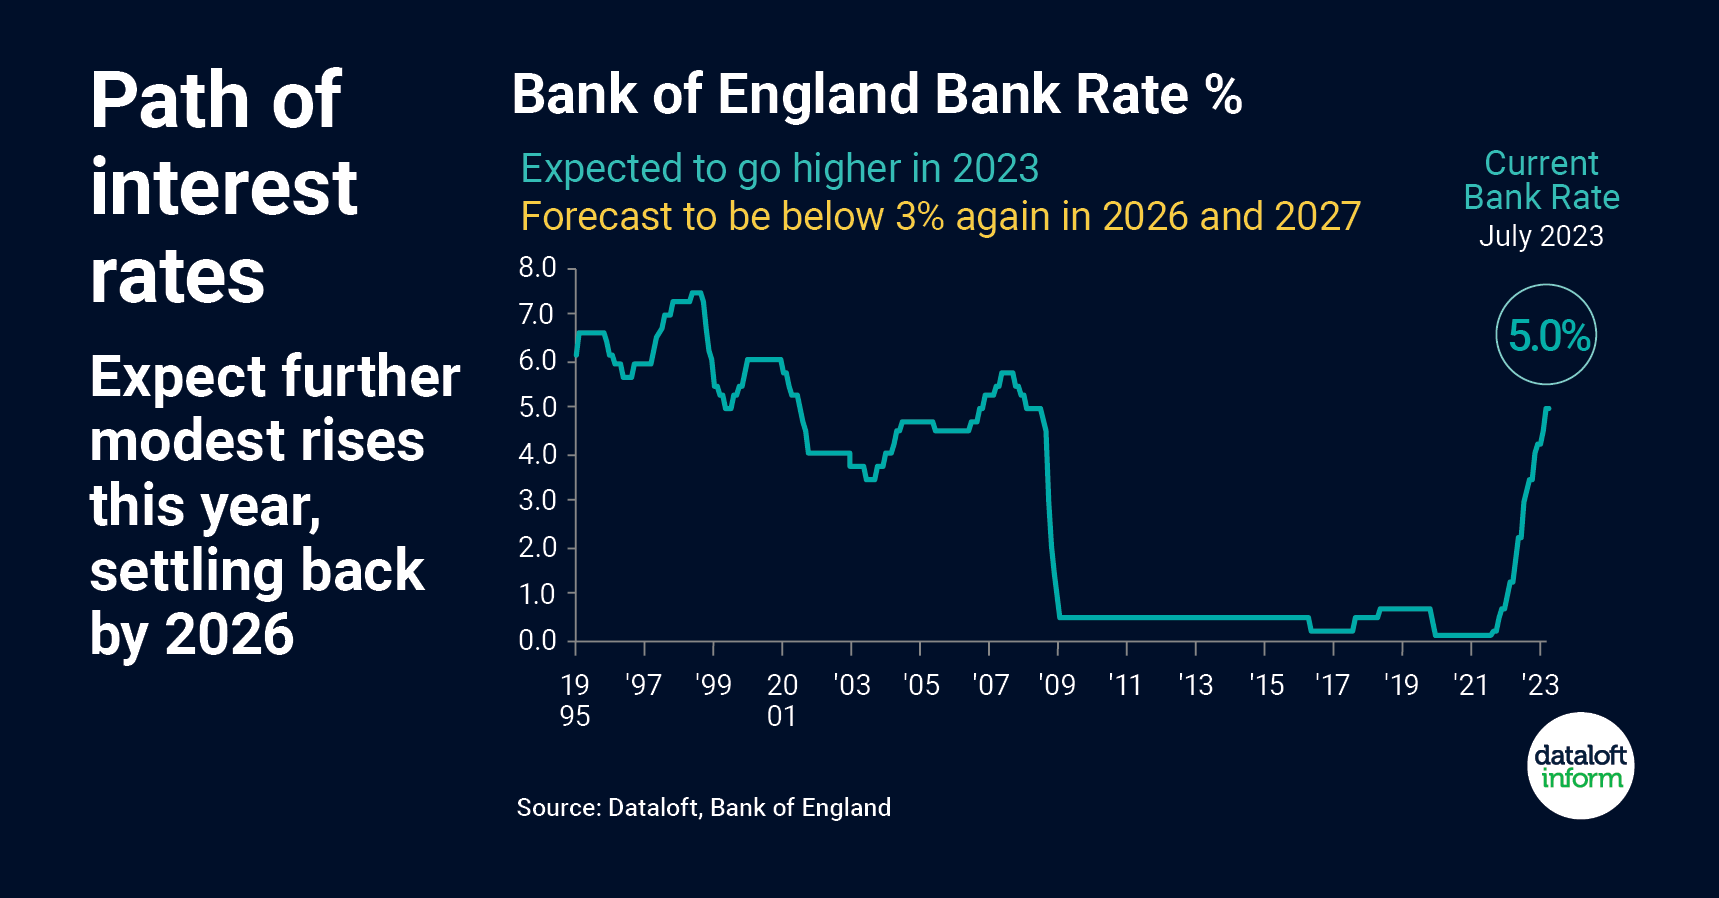
- Recent rapid rises in interest rates have left borrowers wondering where this will end. The current Bank Rate is 5%.
- In the short term there are expected to be further interest rate rises. The consensus of forecasts average at 5.6% for the end of this year. Over the longer term the Bank Rate is expected to come down: forecast to be below 3% again in 2026 and 2027.
- The steepness of the increase is comparable with the sharp drop as the economy entered the Global Financial Crisis.
- June inflation data had tentative evidence of improvement which could help improve the long term interest rate outlook. Source: #Dataloft, Bank of England
BUBBLE ANALYSIS: Going down. Interest rates remain high. As this forecast is being written, Bank of England interest rates currently stand at 5.25%. Outside influence may see the interest rates fall in 2024. These influences include the expectation that inflation will fall as we enter the new year and that we have an election process that will be expected to be in full swing in the autumn / winter of next year. Due to these influences we may see the Bank of England through the ‘Government’ decrease the Bank of England Base rate to ease the cost of living crises.
Average number of days to sell, UK:
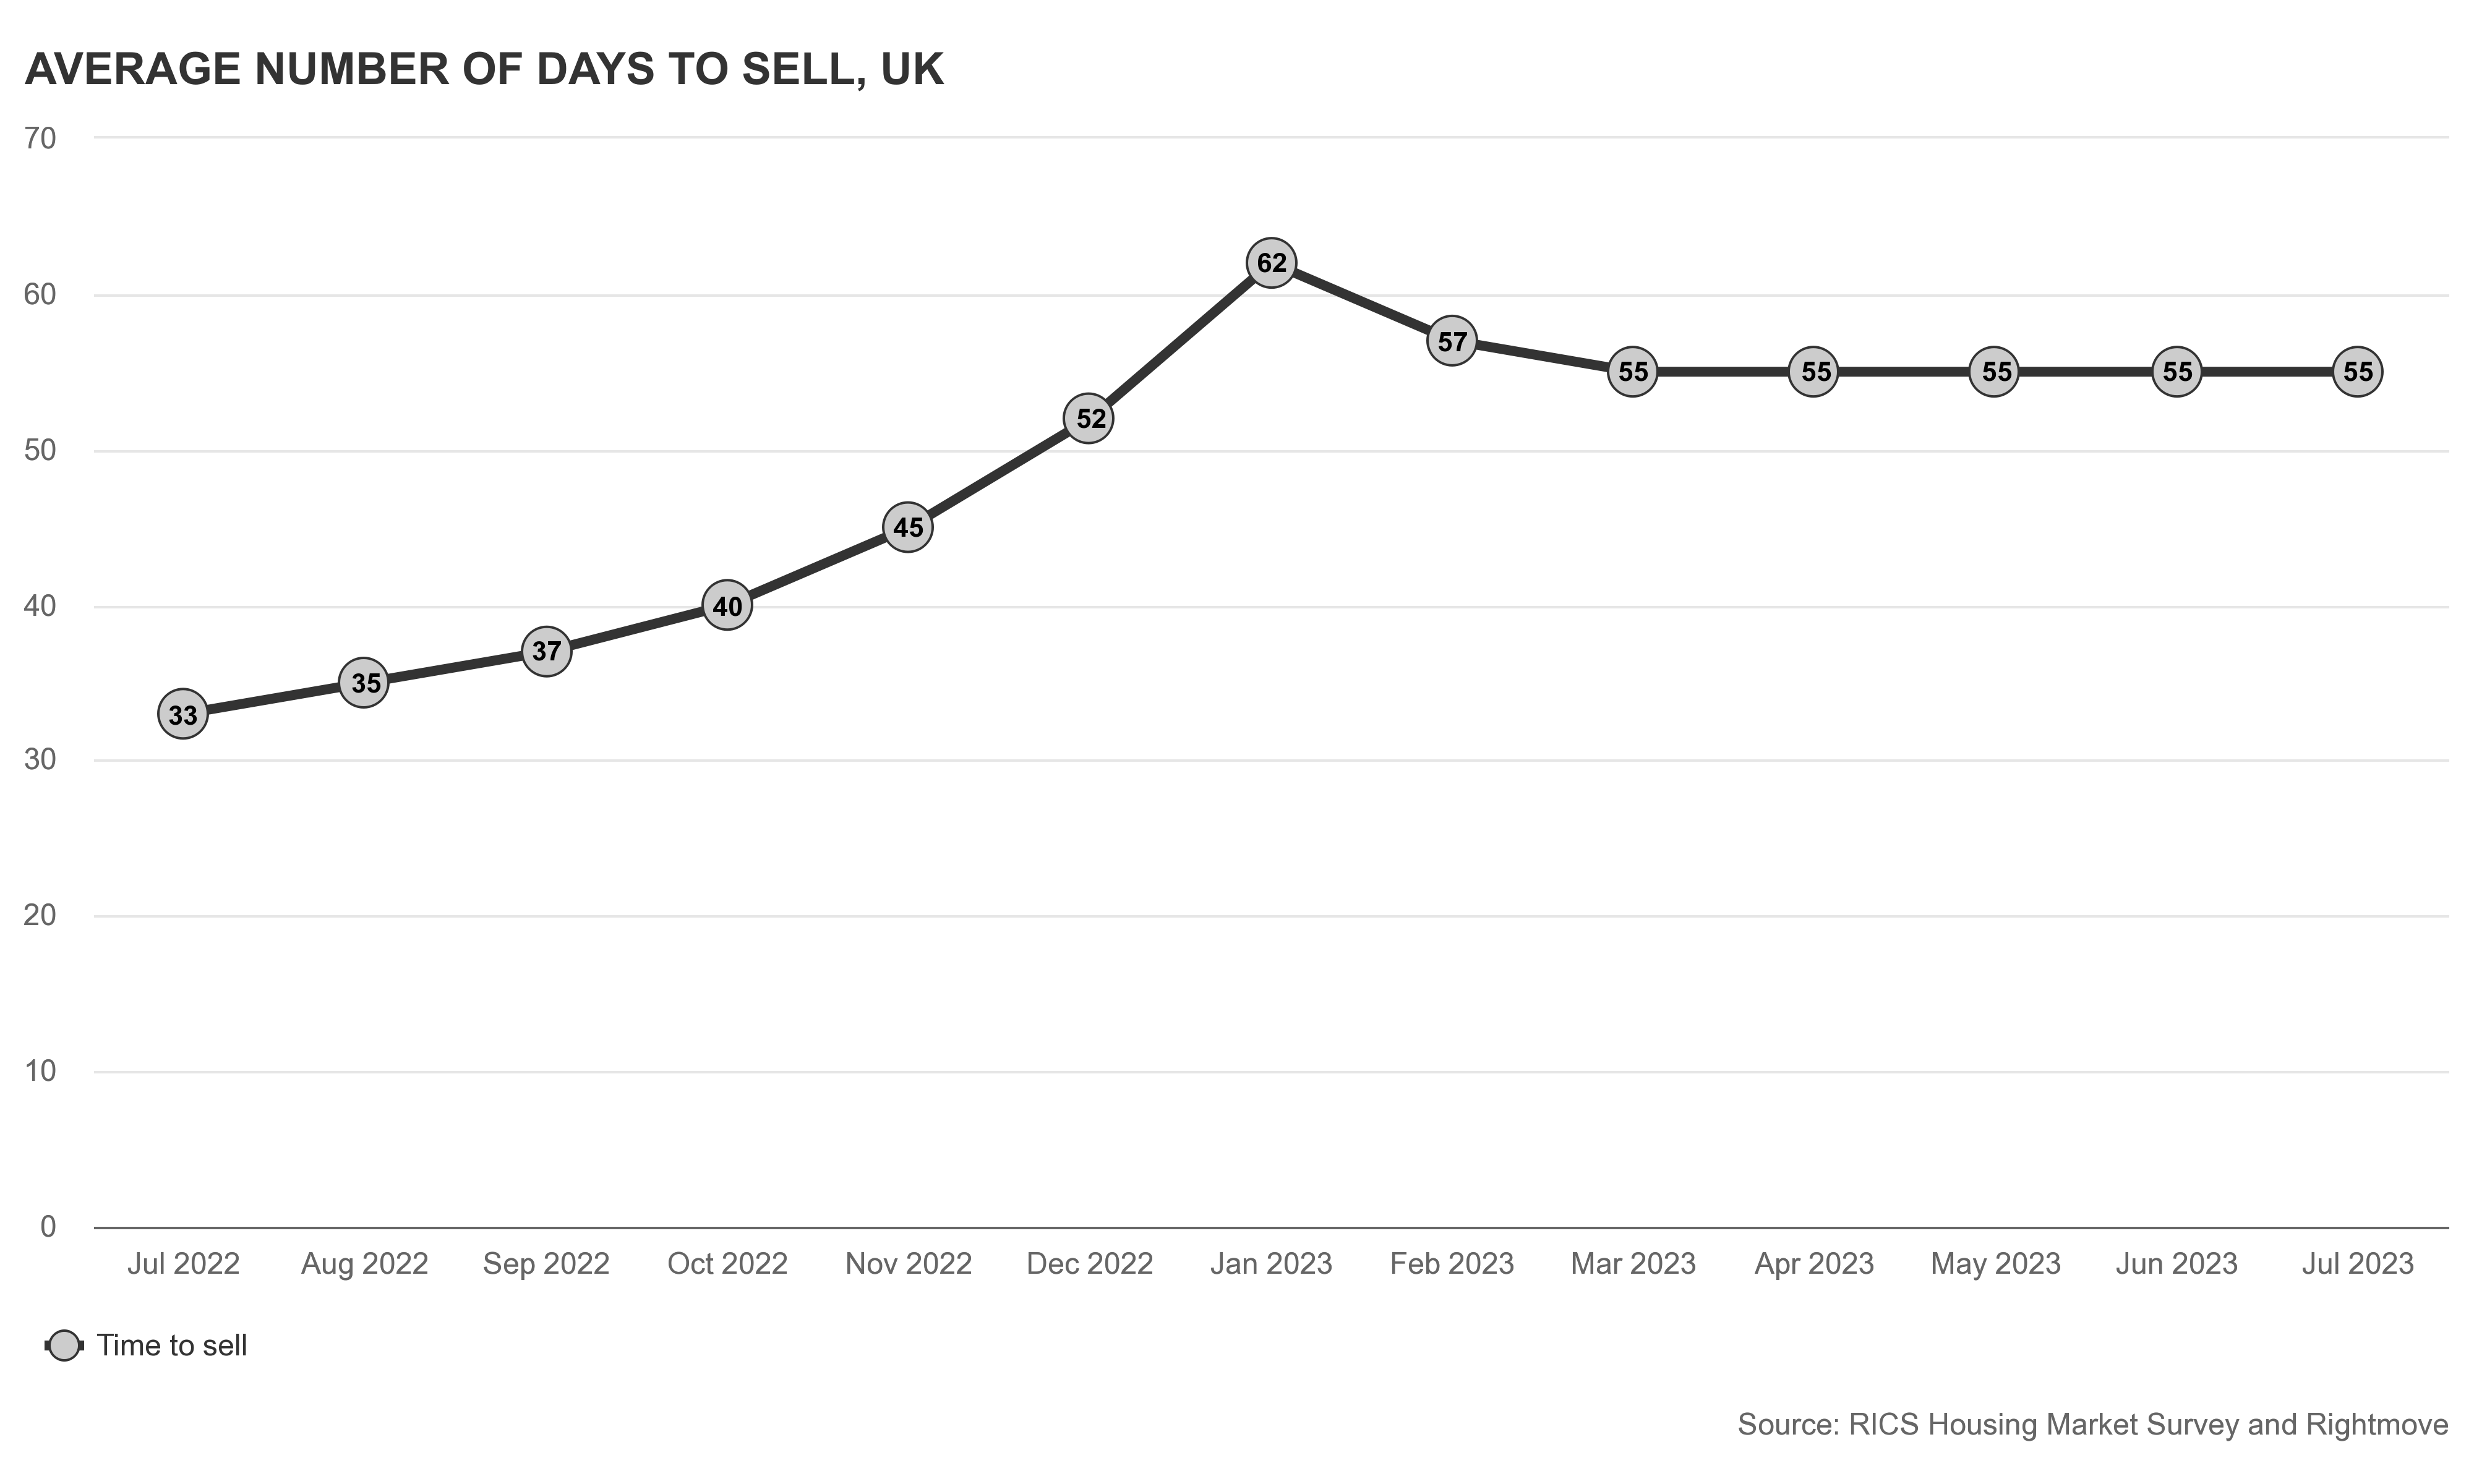
BUBBLE ANALYSIS: Steady. The average number of days to sell a home across the UK has decreased since January and has stabilised over the course of the year. Houses that have sold currently take an average of 55 days to do so across the UK. We expect this trend to continue throughout the rest of the year and into the start of 2024. This figure does not include homes that have not sold or homes that have been withdrawn from the market.
Average asking prices :

BUBBLE ANALYSIS: Trending Downward. Unfortunately, neither the annual growth nor the recent monthly growth in asking prices on Rightmove is positive. We anticipate this trend to continue into early 2024. Sellers are now recognising the buyer’s market, and frequent price reductions/corrections in marketing prices are becoming evident in the Greater Peterborough area.
Key housing market indices:
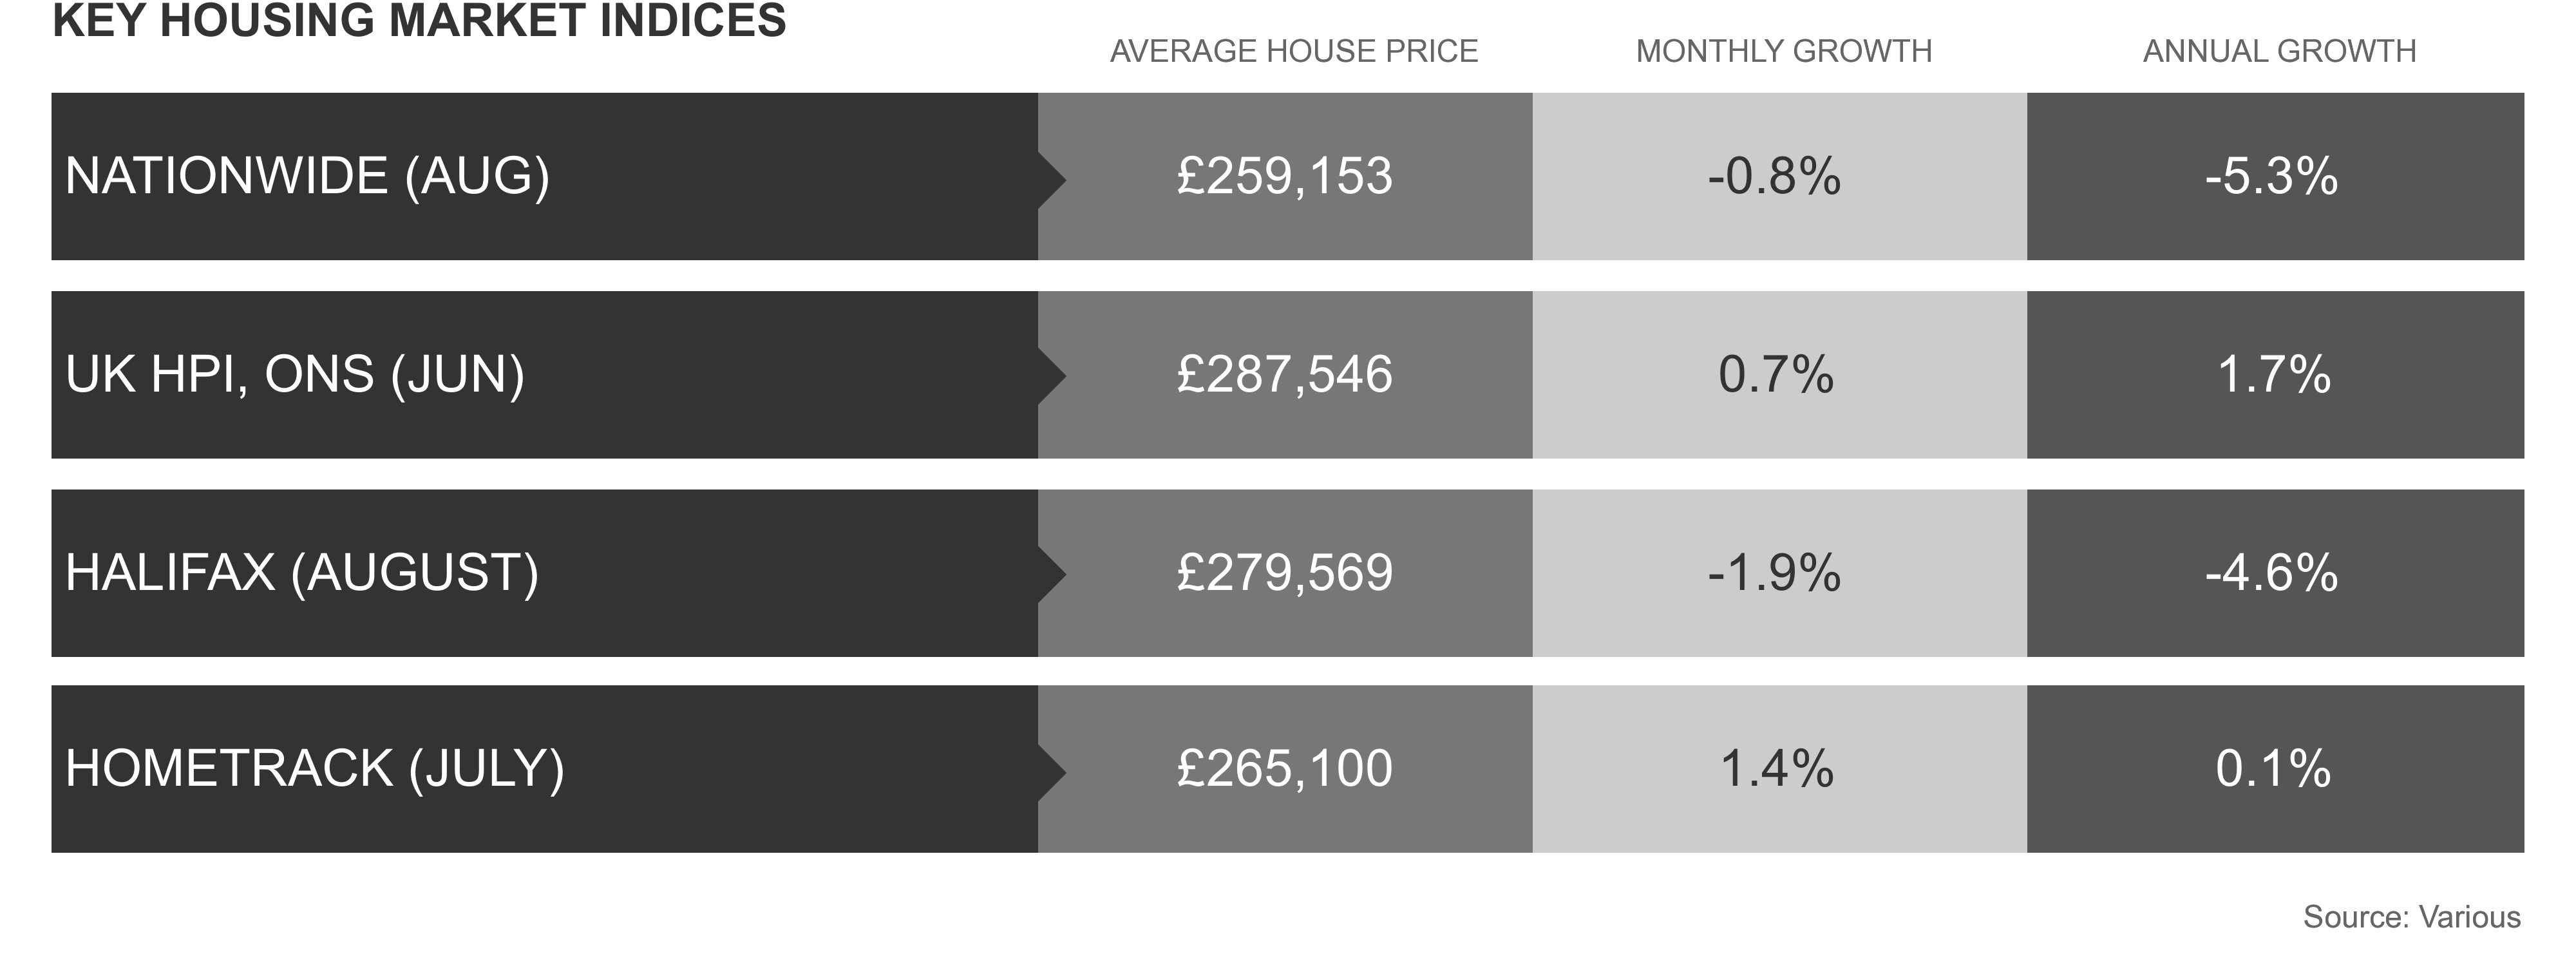
BUBBLE ANALYSIS: Trending Downward. The ongoing cost of living crisis is now starting to manifest in historical data analysis, where indices are declining on a monthly basis. There is a noticeable North/South divide, with the southern area of the country experiencing a downturn, while some northern areas are seeing slight gains or a levelling off of property values.
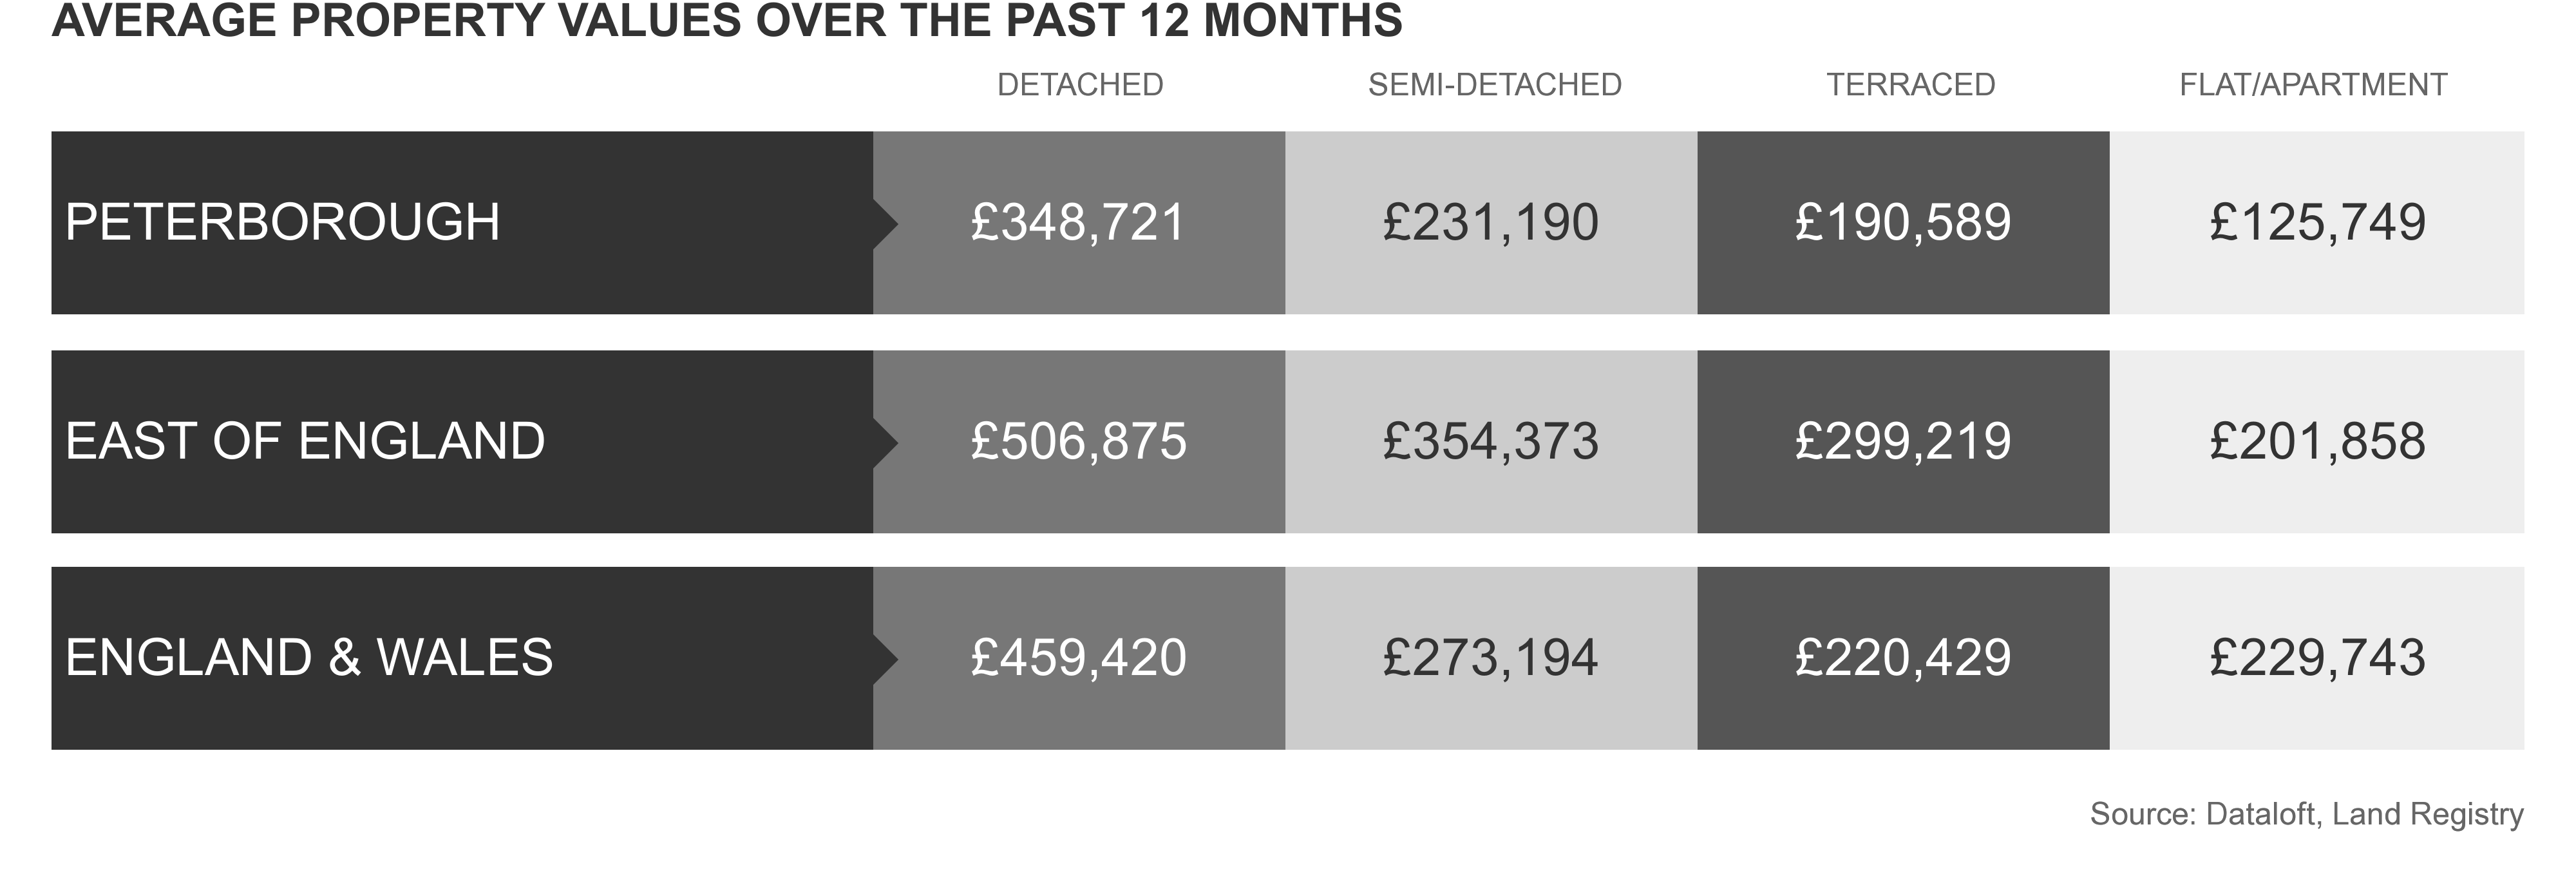
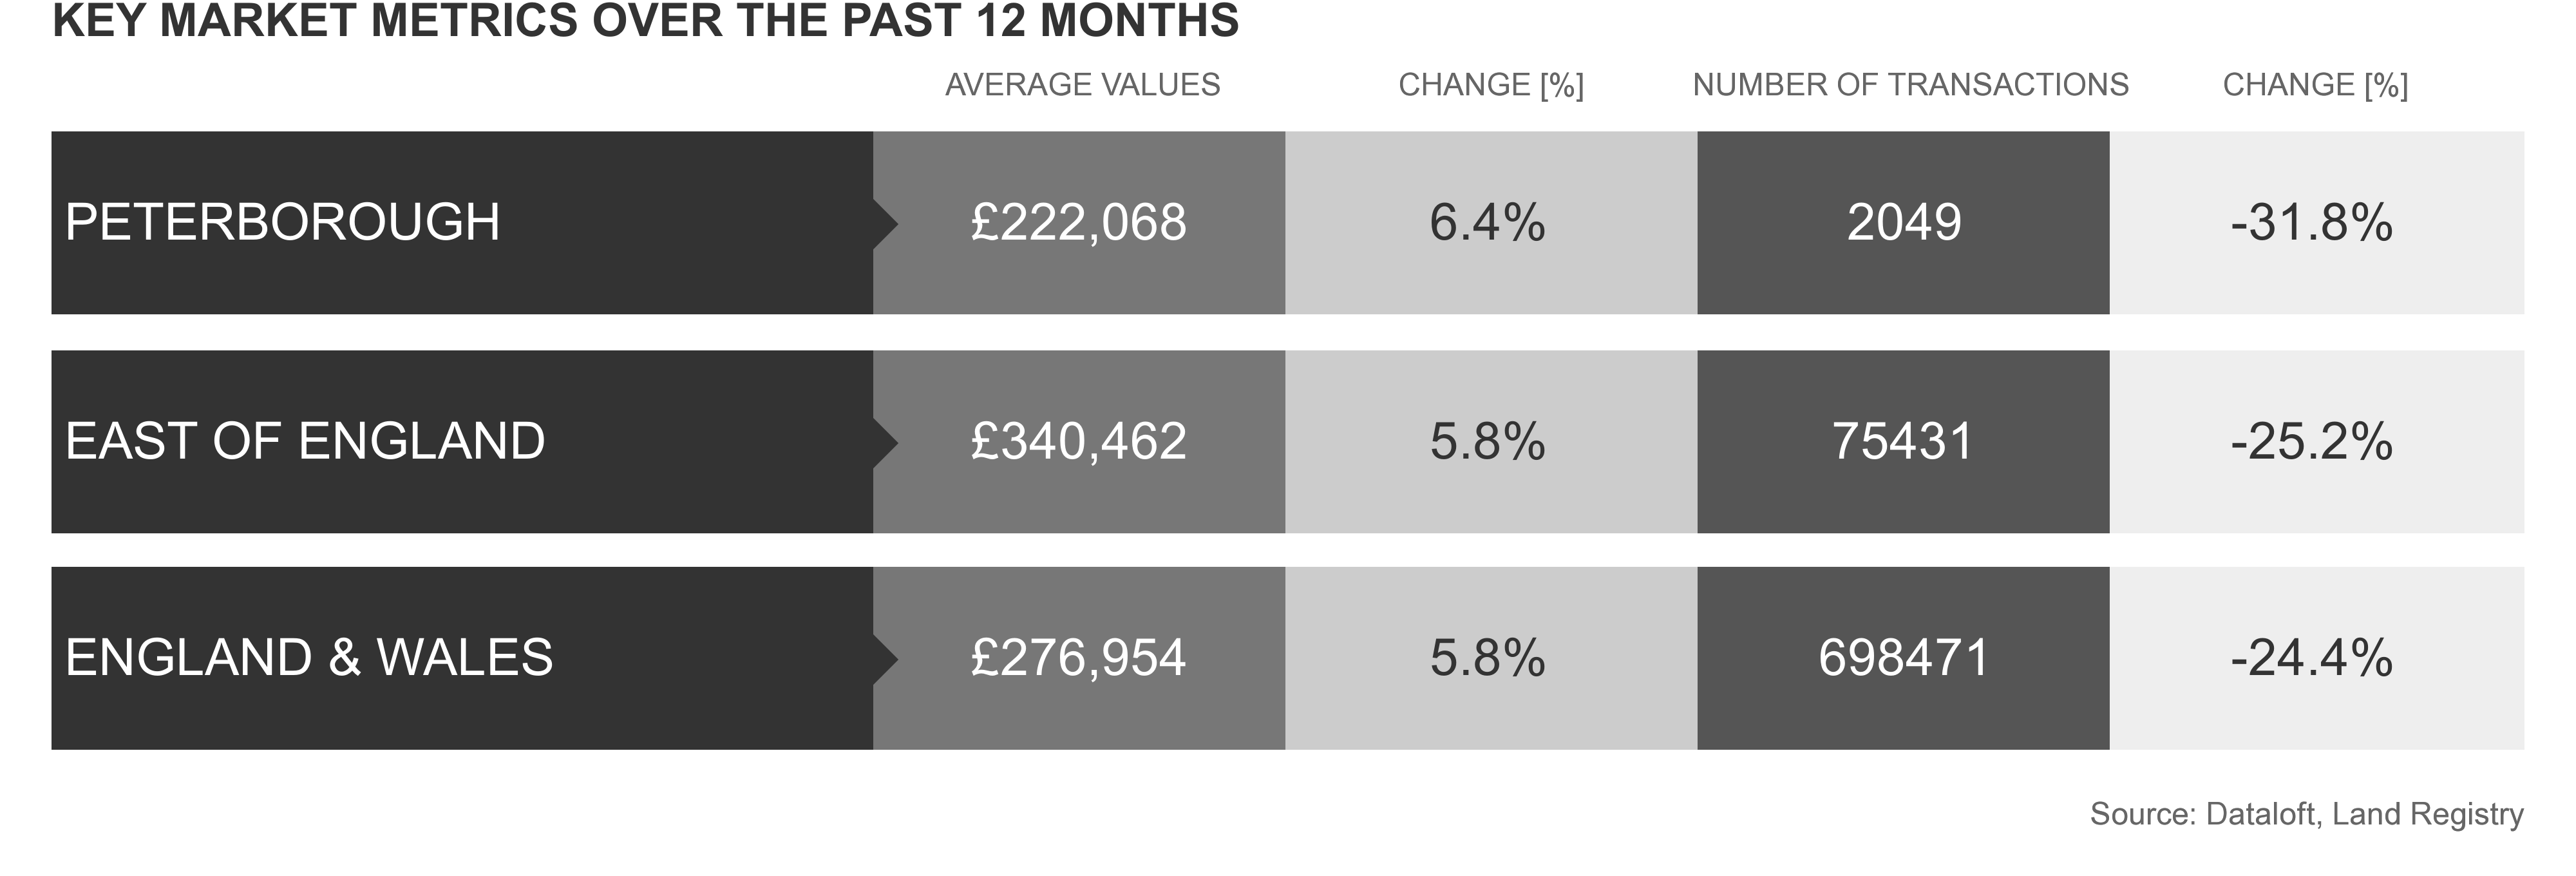
LOCAL MARKET PETERBOROUGH
BUBBLE ANALYSIS: Trending Downward. Locally, we’ve witnessed a significant decrease in the number of transactions occurring over the last 12 months. The average property values remain relatively strong over a twelve-month period, largely due to the market being much more stable and stronger at the beginning of this period. There are far fewer buyers in the market currently, with a plethora of homes to choose from for those who are looking. Since the start of the year, there have been 6,980 properties listed on Rightmove in the Greater Peterborough area, and of those, only 2,172 have sold (according to Rightmove). This situation will persist until mortgage rates become more affordable and more potential buyers enter the market.
Housing and wider outlook.
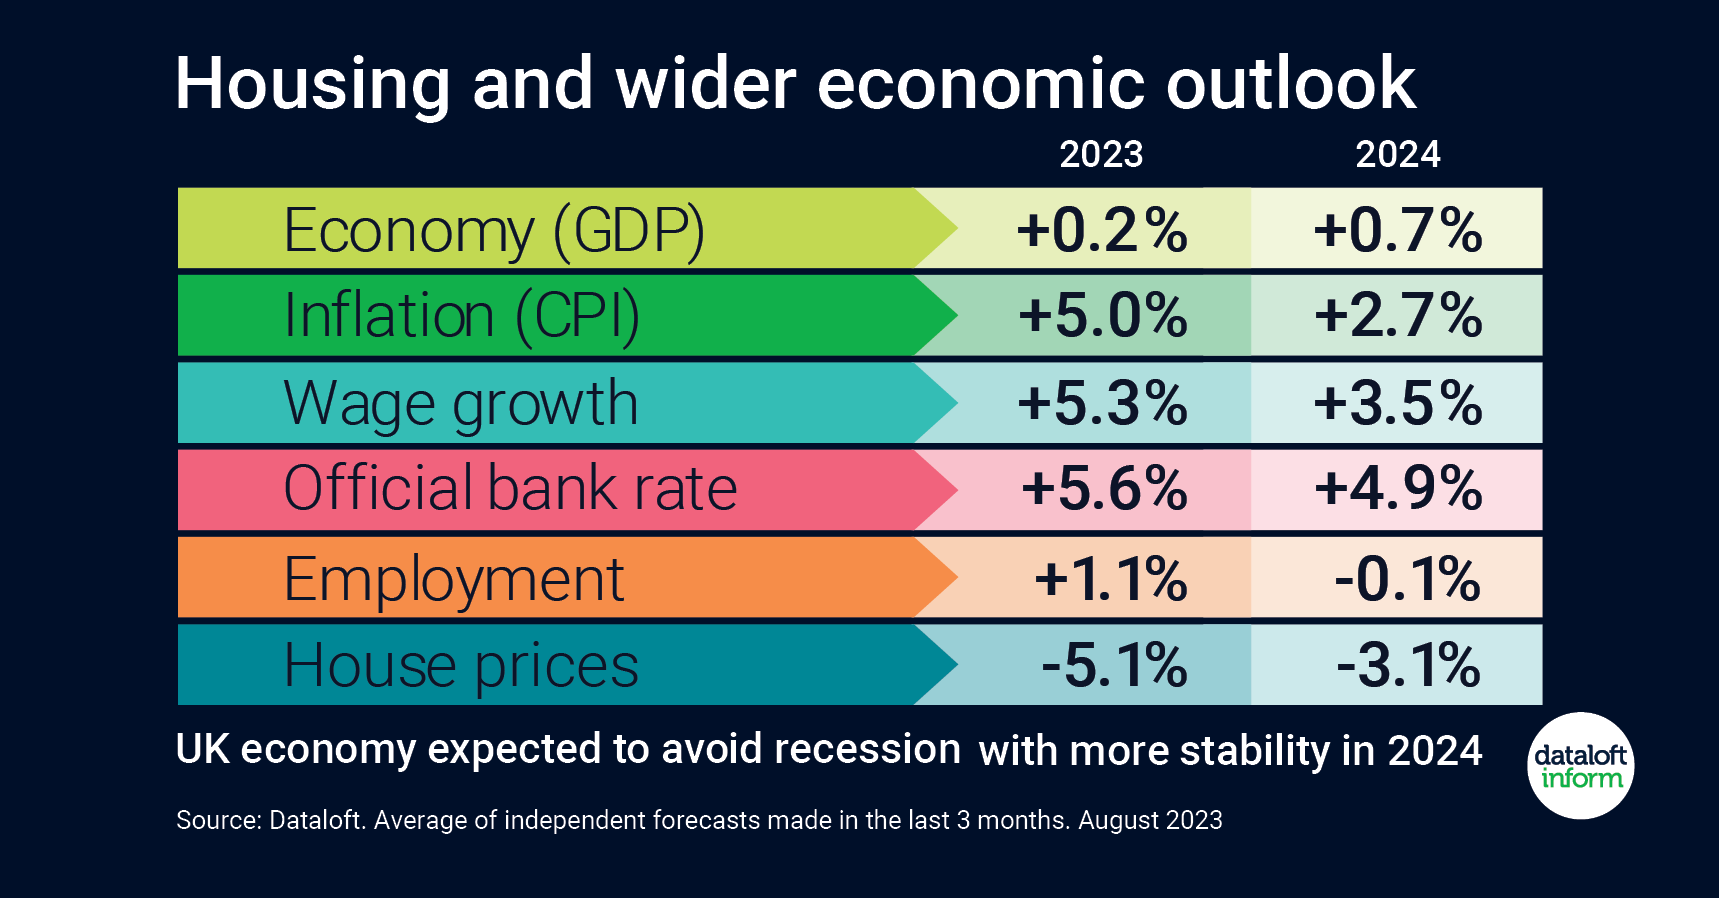
- Monitoring the outlook of various economic indicators gives us a good view on both the current and future direction of the UK’s housing market.
- With 14 consecutive interest rate rises, the Bank Base rate reached 5.25% in August. Latest projections are that rates are likely to peak before the end of the year, having successfully begun to curb inflation.
- Inflation is expected to remain ahead of target (2%) while wage growth remains high and employment continues to grow.
- More stability is expected in 2024 with the UK economy now expected to avoid recession. Nationally, house prices falls seem inevitable, but with an election on the horizon, expect some new policy incentives for first time buyers. Source: #Dataloft. Average of independent forecasts made in the last 3 months. August 2023
BUBBLE SUMMARY
BUBBLE ANALYSIS: Nationally, we’ve examined the implications of the dramatic rise in mortgage rates and what we can anticipate as we head into the end of 2023 and the beginning of 2024. Current market conditions are challenging for everyone, and we do not expect this to change anytime soon. House prices will need to continue to fall if mortgage rates remain at their current levels, as affordability for the vast majority of people is nearing an impossible cost for larger homes.
Locally in Peterborough, we remain an attractive option for buyers currently living in London or the A1 corridor. With our lower cost of living, it is feasible to travel into the capital once or twice a week and work from home, thanks to the availability of high-speed broadband. Due to rising costs, we are witnessing a large number of people leaving London and the A1 corridor because living in these locations has become too expensive. Here in Peterborough, we must take advantage of this migration, which will enable sellers to move on to the next chapter in their lives.