
I’m forever blowing bubbles,
Pretty bubbles in the air,
They fly so high, nearly reach the sky,
Then like my dreams they fade and die.
A song written in 1919 in the states and made famous in the music halls of Britain in the 1920’s. Football fans will instantly relate the tune to West Ham United however, the song could also have been adopted by the UK press when discussing the housing market cycles.
When will it happen, how will it happen, it is bound to happen. Some pray for it (first time buyers) Some seem to bet on it on an annual basis (some members of the property press) and some are looking to take advantage of it happening (speculators / investors).
So where are we in the cycle of housing bubbles, is the bubble rising, fading or ready to burst?
Let’s look at a few fundamentals in 2022 (mid year)
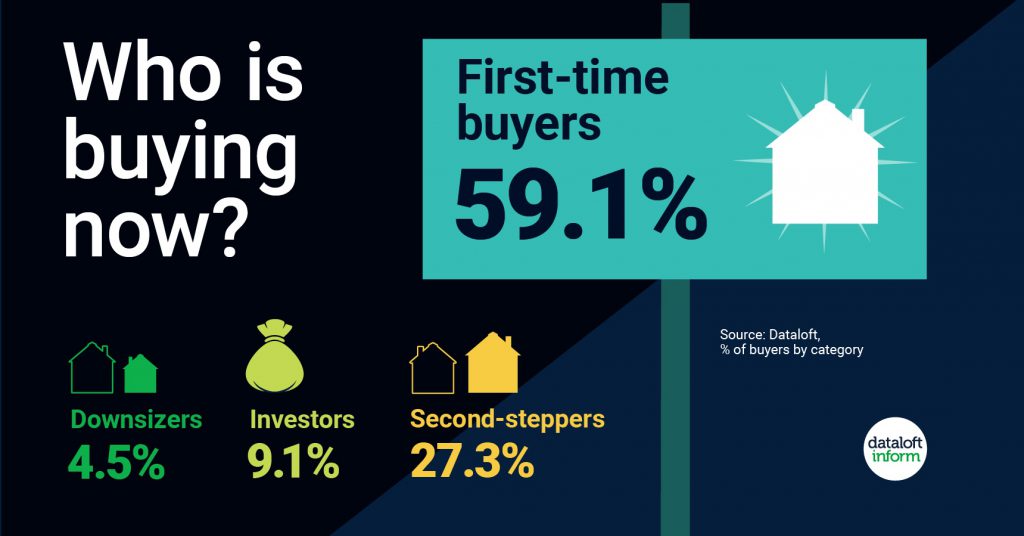
- The number of first-time buyers grew by 35% in 2021, compared to the pandemic year of 2020, despite the ongoing uncertainty.
- Close to 60% of agents in the latest Dataloft subscriber poll reported that first-time buyers were the most popular type of buyer at present, over twice as many as those who said it was the second-steppers.
- Key drivers of demand are falling unemployment, low borrowing costs and an increased number of low deposit mortgage deals.
- The stamp duty holiday and a drop in expenditure during lockdowns may have boosted deposits for the 60% of first-time buyers who are in the top 40% of incomes (English Housing Survey).
Source: Dataloft, Yorkshire Building Society, % of buyers by category
Bubble analysis – flying high supported by continuing, although rising low interest rates which are still available to most applicant types. And many have yet to spend the money they have saved or received during the lockdown due to the lower stock levels.

- Nearly half a million landlords expect to expand their portfolio over the next two years.
- Just over 17.5% of landlords who responded to the 2021 Landlord Trends Survey stated they expected to expand. Extrapolated to the 2.65 million landlords in the UK on record with the HMRC, this equates to 465,000 landlords.
- Professional landlords were nearly twice as likely to be considering expansion as those who considered themselves so-called ‘accidental’ landlords. 75% of accidental landlords are set to maintain their portfolio at its current level.
- Less than 1% of all landlords cited the COVID-19 pandemic as a reason to either expand or decrease their portfolio over the short term. Source: Dataloft, Property Academy Landlord Trends Survey 2021, HMRC
Bubble analysis – flying high. Many landlords are flush with savings from the Covid lockdown as well as big increases in the asset value of their current property investments. With sometimes two sources of available cash investors are competing once more with first time buyers and second steppers when bidding for property, even with the extra stamp duty that is due!
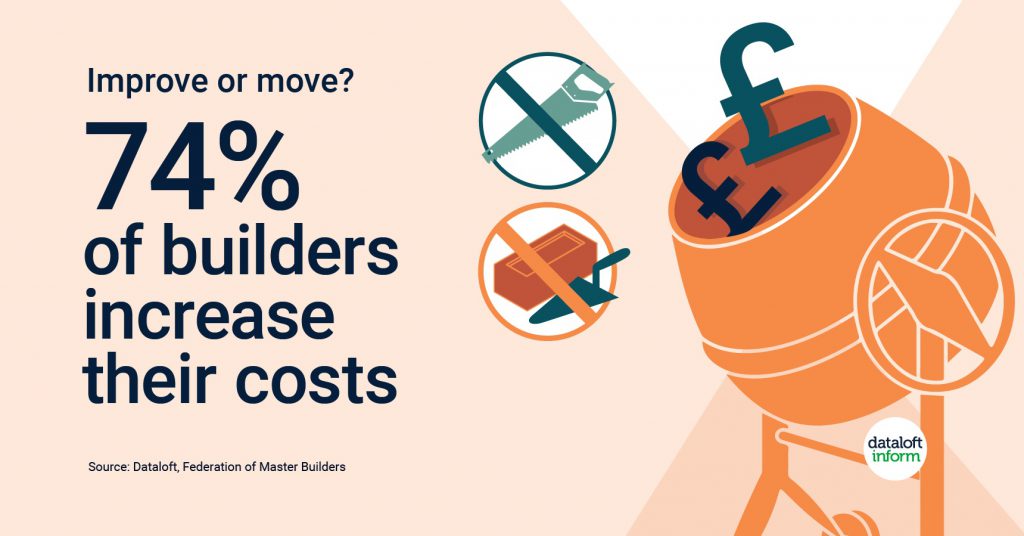
- The Federation of Master Builders’ latest State of Trade Survey reports that 74% of builders have raised prices for their work in Q4 2021.
- At a time when they are reporting a 19% increase in workloads, 95% of builders are also seeing a rise in the cost of materials.
- Labour shortages are also making it hard with 43% struggling to hire carpenters and 41% finding it difficult to find bricklayers.
- Increased cost for home improvements, labour shortages and material price rises, may prompt homeowners to consider moving over improving.
- The property market is busy, with the start of 2022 seeing no slowdown in sales activity.
- Nearly 107,000 sales were recorded in January. Except for 2021, this is the strongest start to a year since 2007 and up 10% on the January average (2012–2021).
- Demand continues to outpace supply, sustaining pressure on prices. Rightmove report the biggest monthly jump in the asking price of newly- listed property since 1994.
- In a sign of more balance returning in future months, home valuation requests were up 27% in January year-on-year, and up 50% compared to 2020 (Rightmove).
- In the sales market, participants recorded a net balance of +16% for new buyer enquiries, up from +9% in December. This is the strongest figure since May 2021.
- Conversely, supply of properties (new instructions) remains constrained in both the lettings and sales markets and will continue to put pressure on prices. Source: Dataloft, RICS (net balance of survey participants). The RICS net balance score is calculated by the proportion of survey respondents reporting a rise minus those reporting a fall in the given indicator.
- The Chancellor warned that the global economic outlook is ‘challenging’ in his Spring Statement. The OBR has lowered its economic growth forecast to 3.8% this year, down from the 6% forecast in October.
- Property price growth is expected to outperform economic growth this year, averaging 7.4% over 2022, before slowing to 1.3% in 2023. No price falls are predicted over the next five years.
- Wage growth is forecast to be in the region of 5.2% in 2022, higher than average. However, inflation is expected to average 7.4% and not return to below 2% until 2024.
- Measures taken to tackle rising costs include: a 12-month cut in fuel duty, an increased National Insurance threshold and 0% VAT on energy-efficient equipment.
- More choice is returning to the housing market, with agents reporting a rise in new instructions in both the sales and lettings markets.
- The net balance of respondents reporting a rise in new sales instructions was positive for the first time in a year. Letting instructions were positive for the first time since July 2020 (latest RICS survey March 2022).
- Demand for properties to buy and rent remains high however, a continuing shortage of properties is likely to underpin price growth. Despite economic headwinds, price growth seems set to remain in positive territory over the next year.
- The RICS net balance score is based on the proportion of survey respondents reporting a rise, less those reporting a fall in instructions. Source: Dataloft, The Royal Institution of Chartered Surveyors (net balance of survey participants)
- UK interest rates were raised for the fourth time since December (on 5th May 2022), by a quarter of a percentage point to 1%. This is the fastest increase in borrowing costs in 25 years.
- Inflation is running at 7%, which is more than three times its target and is still rising. This is due to the post pandemic-surge in consumer demand and has been exacerbated by the Russian invasion of Ukraine.
- The consensus among a poll of economists by Reuters is that the base rate will rise to 1.5% by early 2023, but will remain there for the rest of that year. This remains low by historic standards.
- Many borrowers will be cushioned from any immediate impact by fixed-rate deals. The proportion of advances on such deals has risen each quarter since the market reopened in June 2020 (94.5% Q4 2021, FCA). Source: Dataloft, Bank of England
- The government’s ‘levelling up’ agenda played a significant role in the recent Queen’s Speech. New research indicates that changing employment patterns may well be providing a kickstart.
- 22 out of the top 25 remote worker hotspots are outside of London and the South East, of which 10 are in so-called ‘Red Wall’ areas.
- Job adverts offering the flexibility to work remotely have tripled compared to pre-pandemic levels in the top ranked so-called ‘Zoom towns’, creating new opportunities for high streets and local economies.
- Societal changes in employment patterns are also likely to impact future housing patterns. Those looking to change jobs may opt for a longer commute on ‘office’ work days rather than relocating lock stock and barrel. Source: Dataloft, Indeed, Zoom (2022)
- There is a very strong relationship between GDP growth rates and house price growth – this relationship stretches all the way back to the early 1980s.
- Assuming this historic relationship holds true, we can expect house price growth to slow later this year, as GDP growth subsides.
- Over the last few months there has been a rapid change in the global geopolitical climate and the outlook for the UK economy. UK GDP growth is forecast to be weaker by the end of 2022 and lasting into 2023.
- The 30 or so economists who contribute to the consensus forecasts compiled by HM Treasury currently believe that GDP growth will slow to 1.3% in 2023.
- Whilst house price growth over the year to end Q1 was the strongest since 2004, house price growth will likely be lower by the end of 2022. Current consensus forecasts suggest lower growth but not price falls. Source: Dataloft, Nationwide, HM Treasury Consensus Forecasts May 2022, ONS
Source: Dataloft, Federation of Master Builders
Bubble analysis – flying high. Supported by the current high cost to improve / extend a home and the volatility of rising material and energy costs means builders quotes are only being offered on an estimated basis with the option to re-quote when required. Few quotes are being offered for works on a fixed priced basis. Therefore, if you need more space buying a bigger home rather than extending offers a more secure, known price when budgeting.
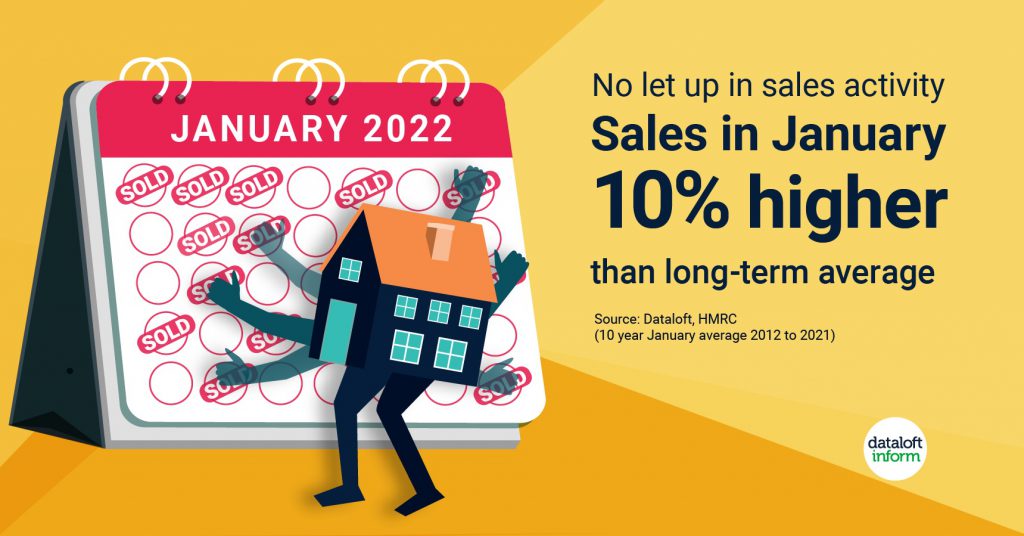
Source: Dataloft, HMRC (10 year January average 2012–2021)
Bubble analysis – Flying high. Supported by a continuing high demand from buyers. Although a higher number of valuations are being recorded by estate agents, only around 50% of owners will list within weeks with many listing their properties over a six month period. Therefore the current rise in valuations being attended by agents will not meet the demand of prospective purchasers today.
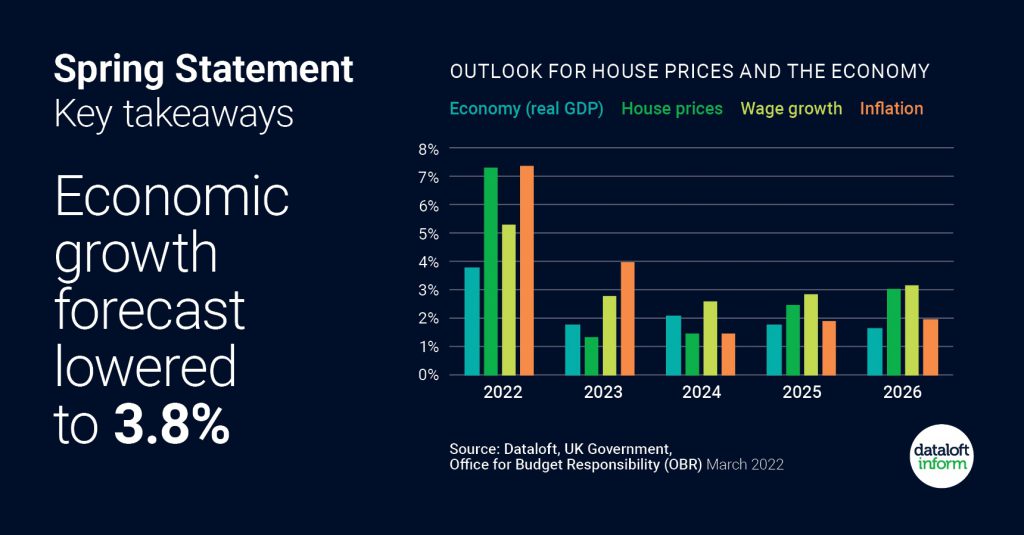
Source: Dataloft, UK Government, Office for Budget Responsibility (OBR)
Bubble analysis – Mixed. Inflation is starting to impact wage growth and outstrip the GDP figures. House price inflation however is keeping pace with the inflation figures in 2022 but these are expected to fall back in 2023.
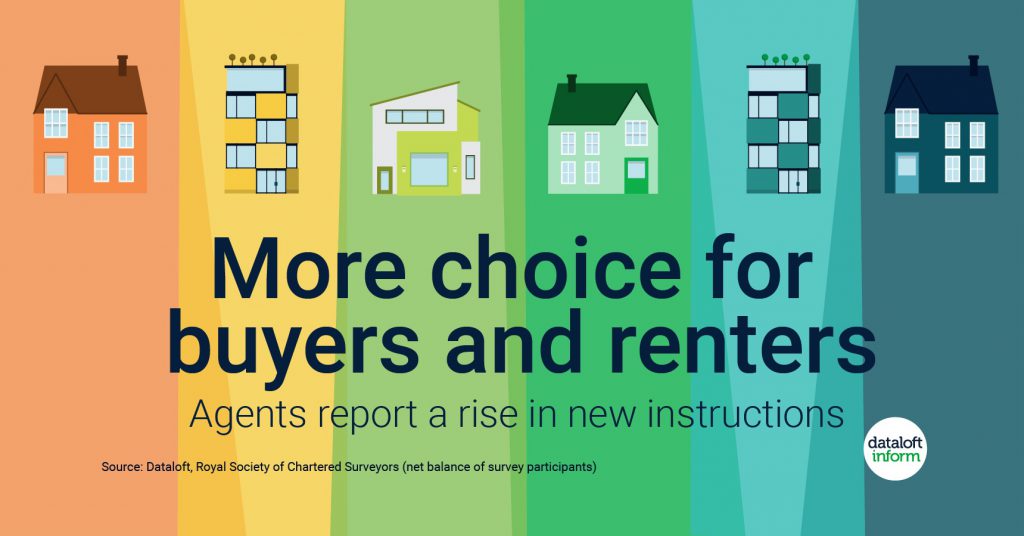
Bubble analysis – Flying high. Instructions were seen to rise in April 2022 which was expected after a rise in valuations were reported in March. However the increased numbers in instructions are still no match for the demand of the available buyers.
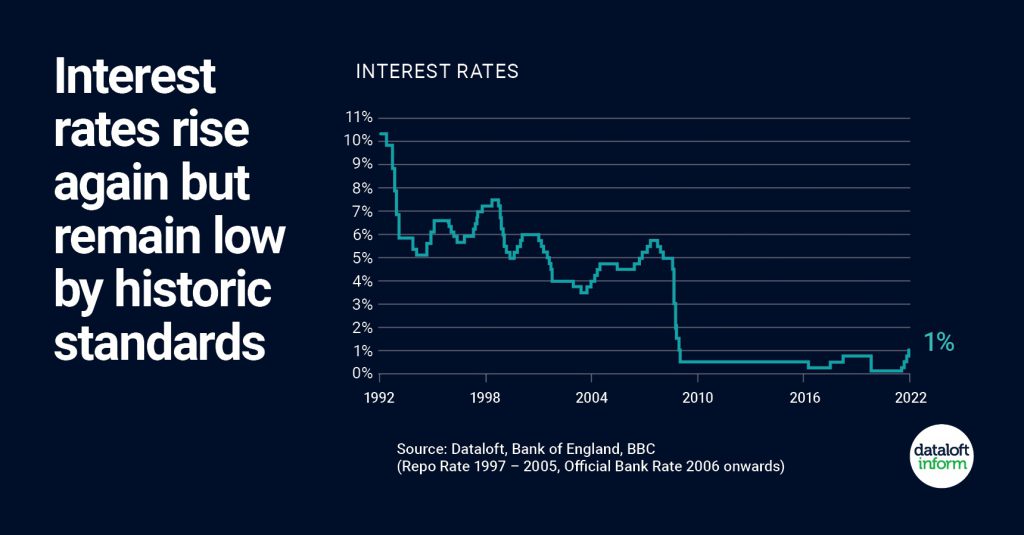
Bubble analysis = Mixed. Both interest rates and inflation have risen in June since this information was available in May 2022. The effect of both to a household’s disposable money and the effect to the growth domestic productivity figures may start to slow the over heated demand for homes to purchase as we enter the back end of 2022. However at this stage in June it looks like we will not go into a recession period and interest rates are still historically low.
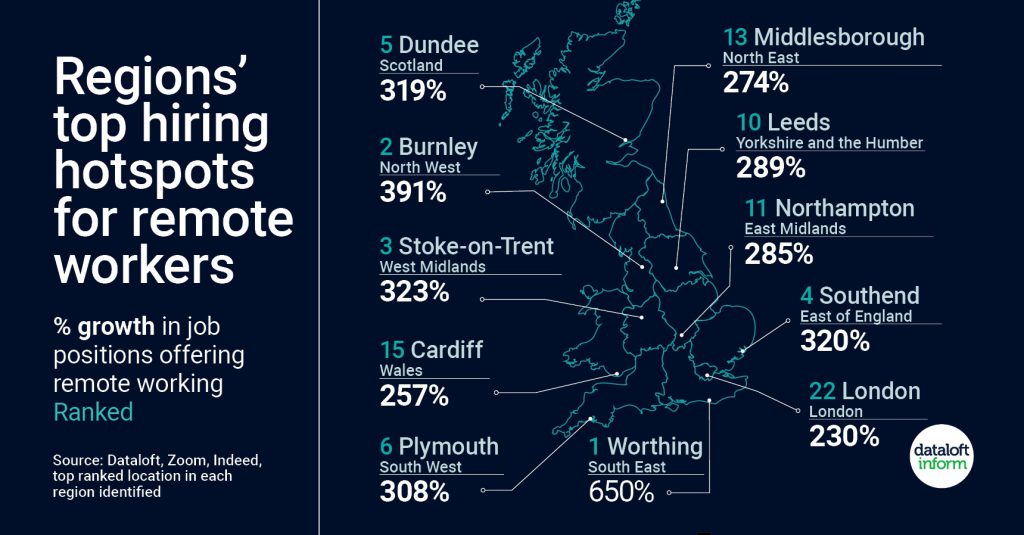
Bubble analysis – High. High energy and fuel costs are going to continue to support the working from home movement. Buyers are looking to exchange fuel costs / travel costs for mortgage payments allowing them to live and work in either a family friendly environment or a lifestyle positive environment. We may continue to see business’s release commercial office space as flexible working environments mature.
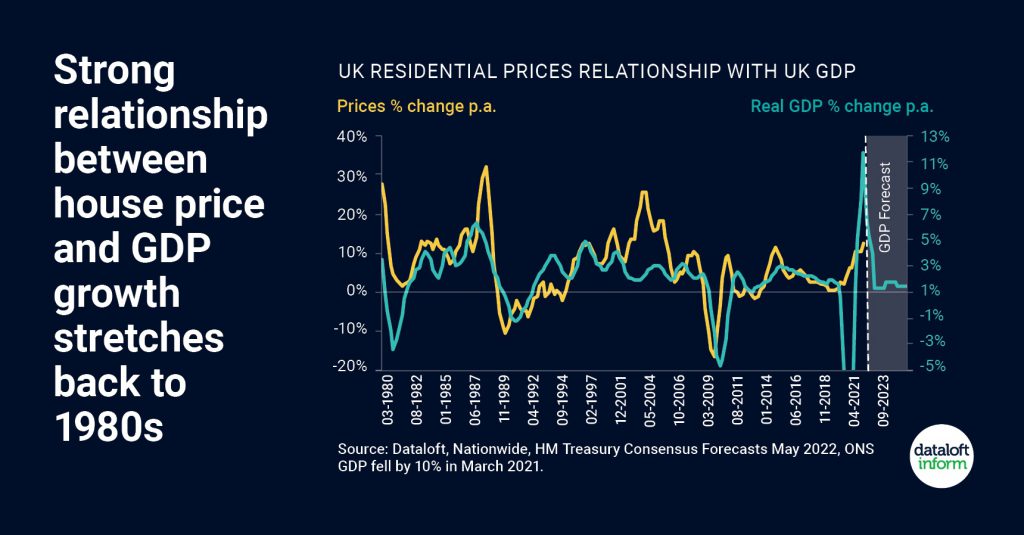
Bubble analysis – Mixed. GDP levels are at risk of lowering into a negative figure due to increases in energy and food costs. The pressure on monthly incomes may slow down the ability of some buyers to pass mortgage affordability tests.
So what about our local market in Peterborough?

Peterborough has seen a 28% rise in property prices in the last 5 years. (Dataloft July 2022)
Peterborough has seen an average sales price rise of 1.4% during the last 12 months (England and Wales 1% Dataloft July 2022).
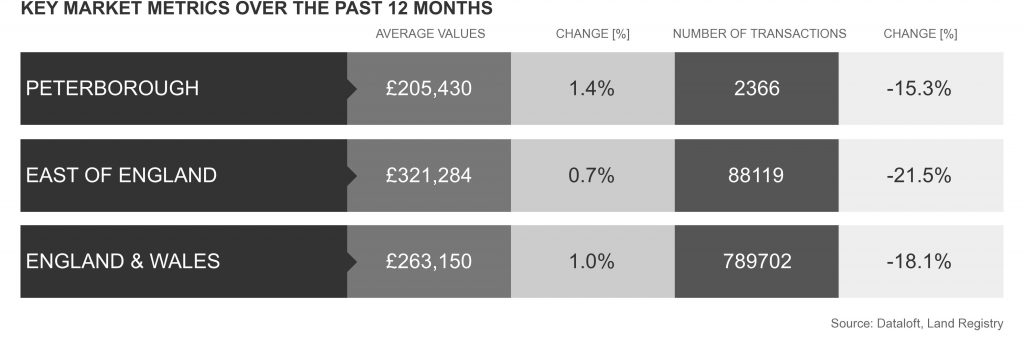
Peterborough has seen a reduction of transactions of 15.3% during the last 12 months. (Dataloft July 2022)
Peterborough has seen an average sales price of £205,430 during the last twelve months (England and Wales £263,150 Dataloft July 2022).
Only 11% of transactions in Peterborough were flats during the last twelve months. (Dataloft July 2022)
Bubble analysis – Mixed. Peterborough continues to enjoy low unemployment figures and lower than the national average purchase costs to own a home at £205,430 (July2022). However, the annual sales price rise of 1.4% in Peterborough does not tell the whole story. Many areas within Peterborough have seen high single numbers to double digit price rises in the last 12 months. Some post code areas have seen these rises in a particular type of housing, i.e detached housing rather across all property types. Up to date data can be found on our Market Data page on our website https://www.tortoiseproperty.co.uk/market-data.html
The national market and the 9 areas of impact
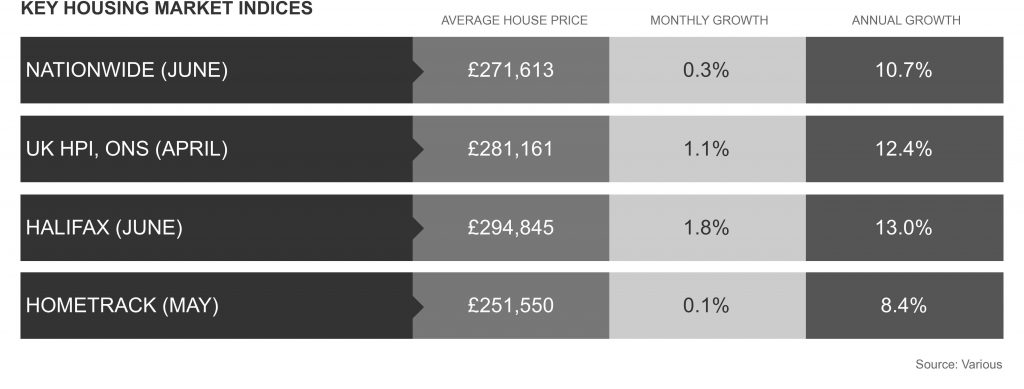
Nationally we looked at 9 areas that impact house prices. Six of these areas continue to push prices upwards where as 3 areas have the potential to slow house prices. All areas are not equal and some of the areas discussed, including increasing inflation, lower growth domestic product and increasing interest rates will have a bigger influence on house prices than some of the other areas highlighted in this analysis. Therefore do not expect house prices to stall for a few months yet however, a slow down in demand is expected as the economic factors that influence the market continue to change.
Our bubble summary:
Although Peterborough enjoys many advantages compared to other Cities in the UK, one being in the top 10 Cities for growth, we are susceptible to high rises in living costs due to our lower average salary levels and lower disposable income figures compared to some parts of the UK.
So we may see the effect of lower disposable incomes effecting potential buyers ability to borrow money in the coming months. Until then the mismatched supply and demand that we see in available homes will continue to support the higher property prices that we have seen so far in the first half of 2022 in Peterborough and its surrounding areas.
We continue to blow bubbles here at Tortoise Property and check to see if they are on the rise, when they seem to fade and give some pointers where possible as too when they may burst?
So until the next time….
Fortune’s always hiding,
I’ve looked everywhere,
I’m forever blowing bubbles,
Pretty bubbles in the air.
Mike Matthews
Tortoise Property
