

I’m forever blowing bubbles,
Pretty bubbles in the air,
They fly so high, nearly reach the sky,
Then like my dreams they fade and die.
A song written in 1919 in the States and made famous in the music halls of Britain in the 1920’s. Football fans will instantly relate the tune to West Ham United however the song could have also been adopted by the UK press when discussing the housing market cycles.
So where are we in the cycle of housing bubbles, is the bubble rising, fading or ready to burst?
Let’s look at the individual areas at the end of 2022:
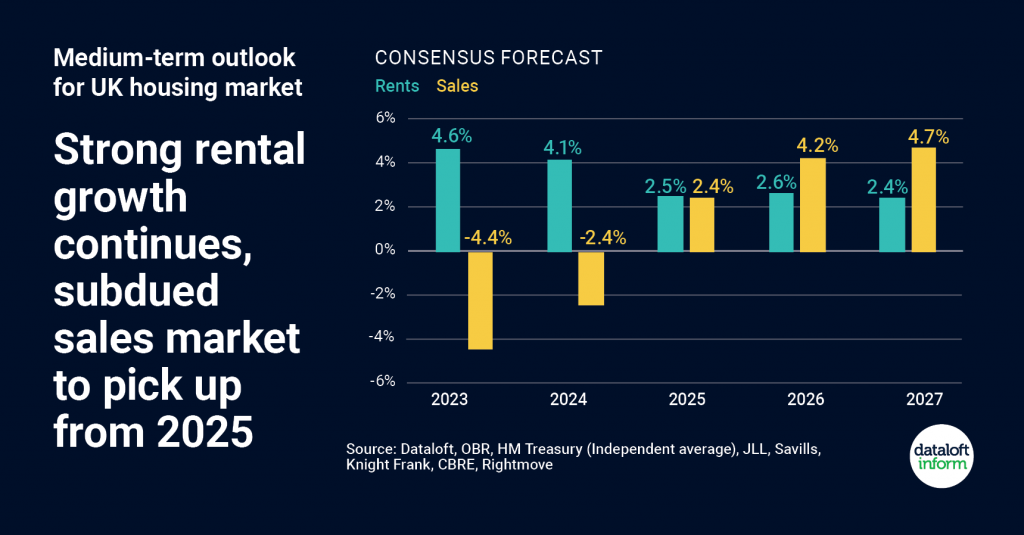
What the experts are saying – Forecasts for the next few years from Savills, Knight Frank, Rightmove
Bubble analysis = Fading. The average analysis shown in the graph over the next two years shows a decrease in prices of 6.8%. However, the individual contributors have mixed thoughts about the actual number for example, Rightmove believe the prices will decrease by only 2%, Savills by 10%, Frank Knight by 10%, JLL by 6% and the OBR by 9% proving that there is no crystal ball, just a fair, experienced judgement. What is known is that the decreases will be felt differently across the country and be specific to local markets.
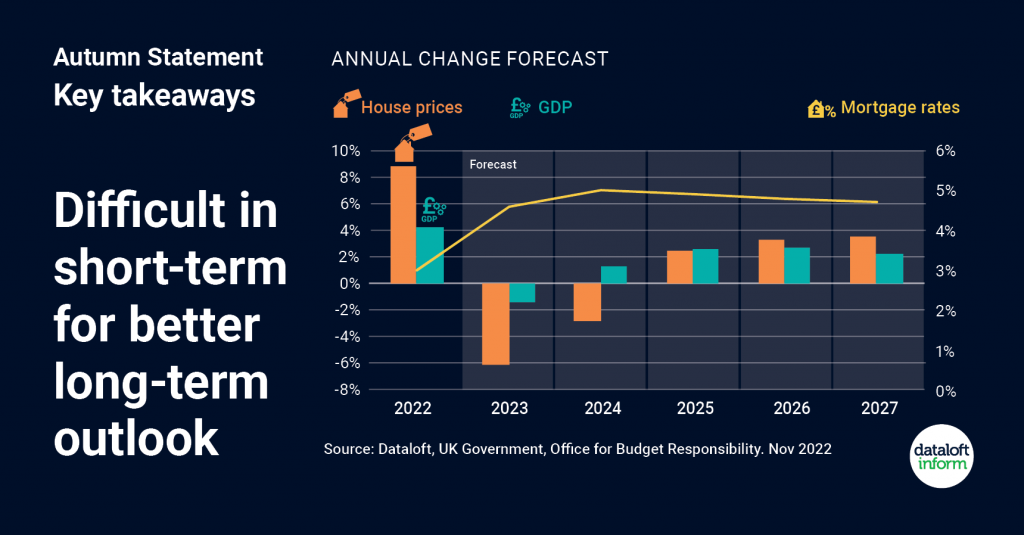
What the government are saying – The autumn statement from the Government / OBR
Bubble analysis = Fading. The November statement delivered by Jeremy Hunt explains that the UK will go into a recession with an expected downturn in the national GDP (gross domestic product) figures. These GDP figures are historically linked to the performance of house prices where on average for every 1% decrease in GDP we will see a house price reduction of 5%.
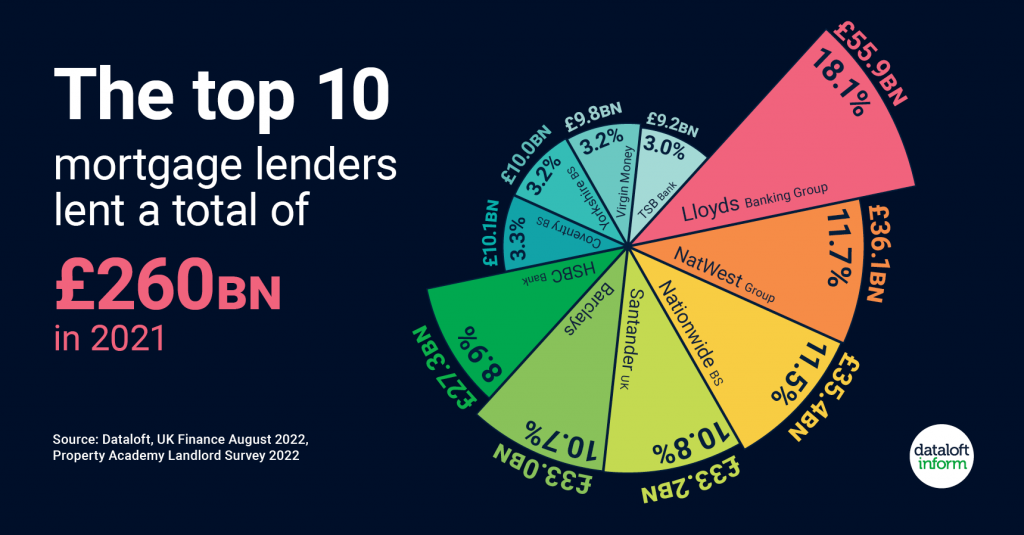
What the lenders are doing
Bubble analysis = Mixed. We have all seen the banks and building society mortgage rates leap. However as we enter the final few days of the year we have seen these start to reduce over the last month. Fixed rates are now available between 4.5% and 5% and tracker and discounted mortgages are becoming more popular as rates have increased. The main message is that we do not have a credit crunch where lenders are unwilling to lend.
What’s been happening to asking price’s
Bubble analysis = Fading. Rightmove have seen asking prices decline for the first time in a number of years however, are reporting that they only expect a 2% decline in 2023. This seems optimistic compared to all other forecasts available.
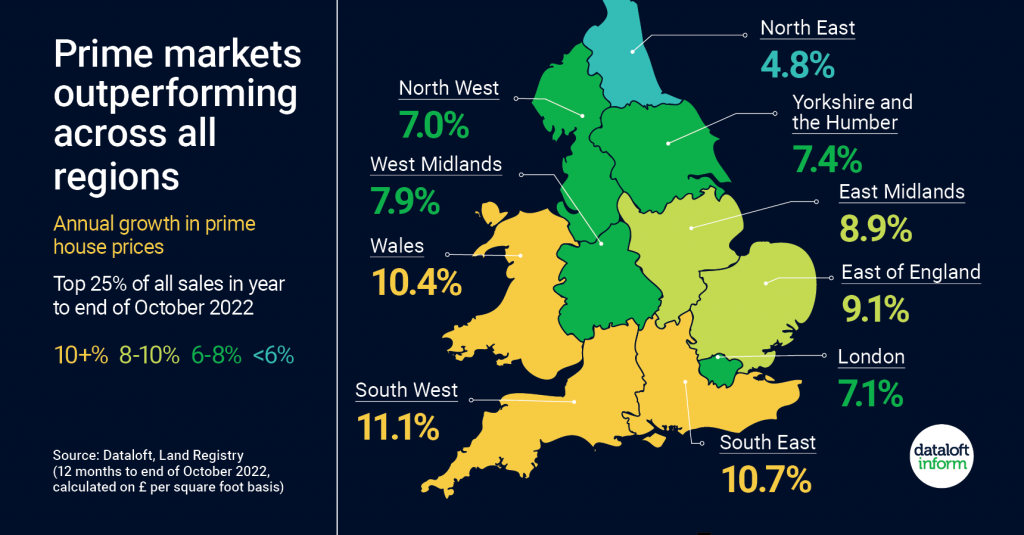
What about the prime market?
Bubble analysis = Mixed. Prime markets will perform differently in different parts of the UK. The low cost of the pound means that international buyers have benefitted in 2022 and will continue to benefit into 2023 meaning that the London Prime market should see a softer landing in this downturn. Elsewhere, the increasing cost of finance and stamp duty will mean that buyers have more choice and negotiating power than they have had in the previous 24 months. Also, due to increased house prices in the past 5 years many houses are now seen as being in the Prime market meaning that this market has grown in size and choice.
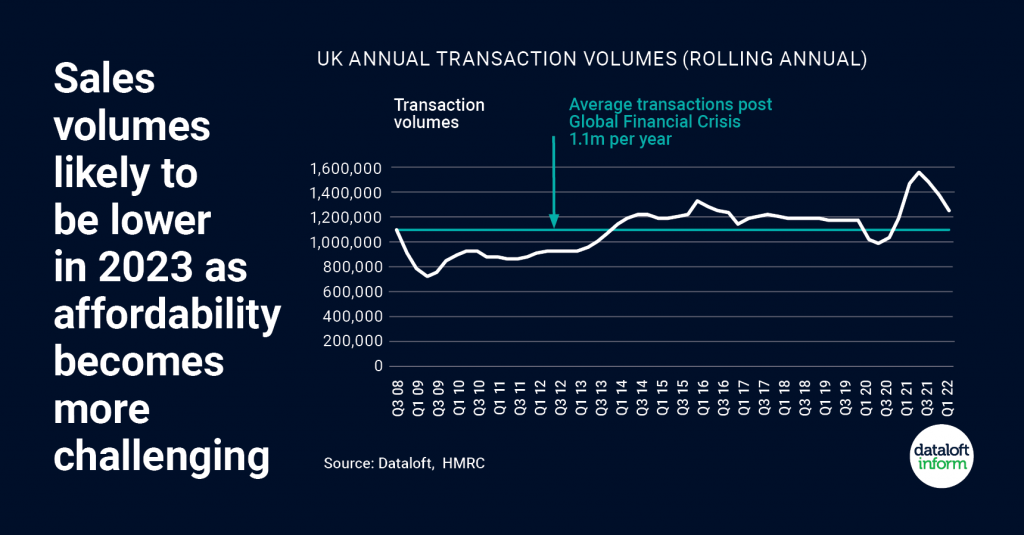
If I want to move, what choice will I have in 2023?
Bubble analysis = Fading. There are different expectations on transaction levels next year with forecasters expecting a fall of between 10% to 20%. However, this does not mean that the choice of homes available will decrease. We are starting to see rising stock levels in the last quarter of 2022 which we expect to continue into the first quarter of 2023 meaning there will be more choice for buyers.
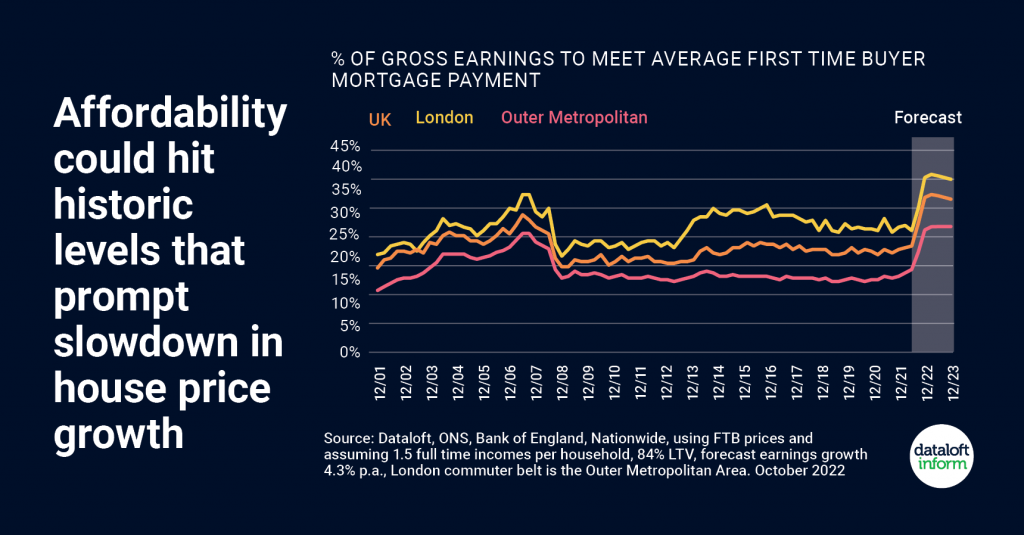
And how much more expensive will it be in 2023 to buy and run a home?
Bubble analysis = Fading. We have seen an increase of 10% in the cost of buying and running a home in 2022 which will continue to rise into the first half of 2023 with increasing costs for fuel expected in April 2023. However the longer term forecast is that this cost will fall in 2024 / 25.
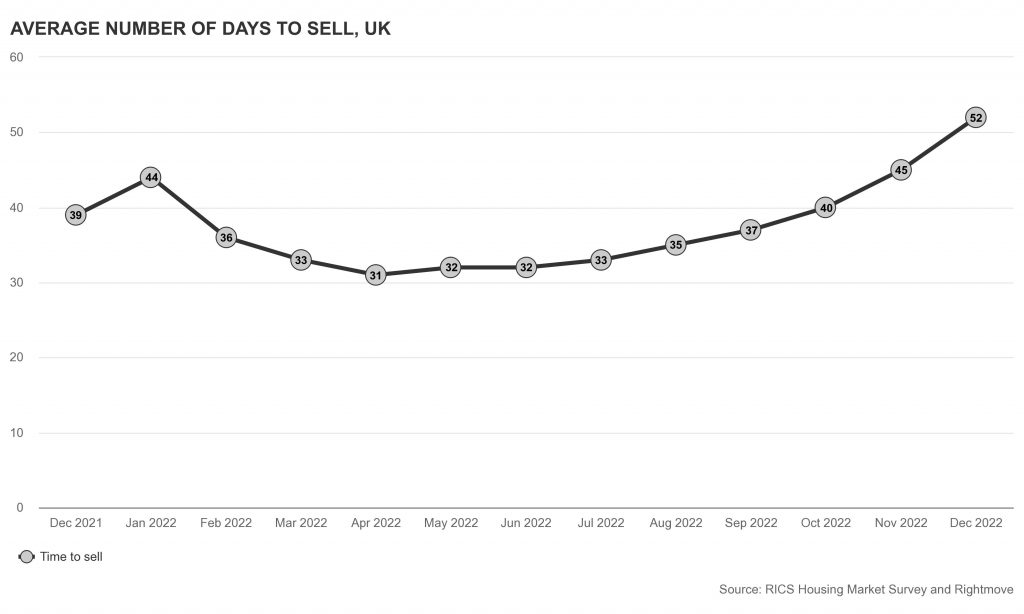
The time it takes to sell a property
Bubble analysis = Fading. The average time to sell a property nationally rose to 52 days in December from the low of 31 days in April. There is a good chance this will rise nationally to 60+ days in the first quarter of 2023.
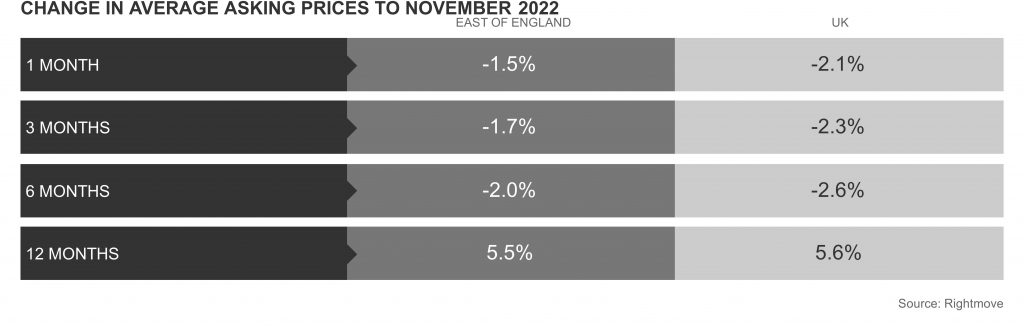
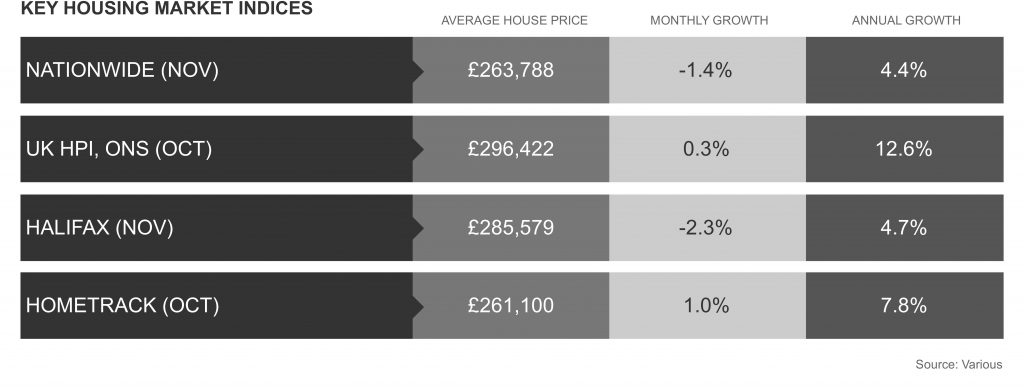
The average price of a property
Bubble analysis = Fading. The 12 month growth average for house prices has been strong. However, the most recent monthly figures are far weaker showing the turning market and weaker house prices going into 2023.
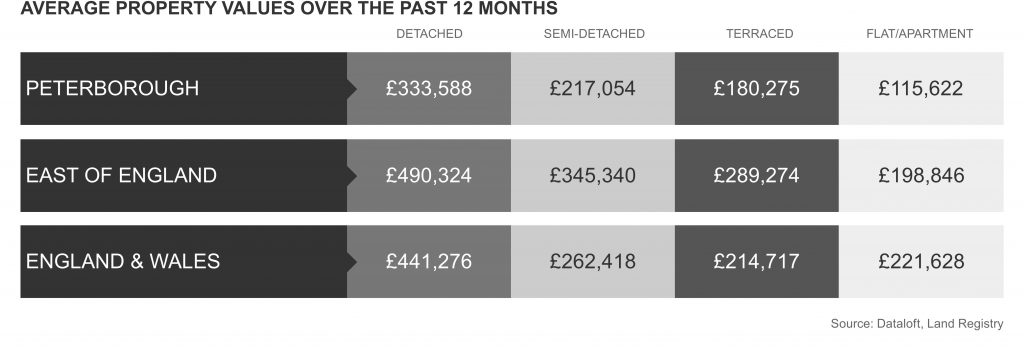
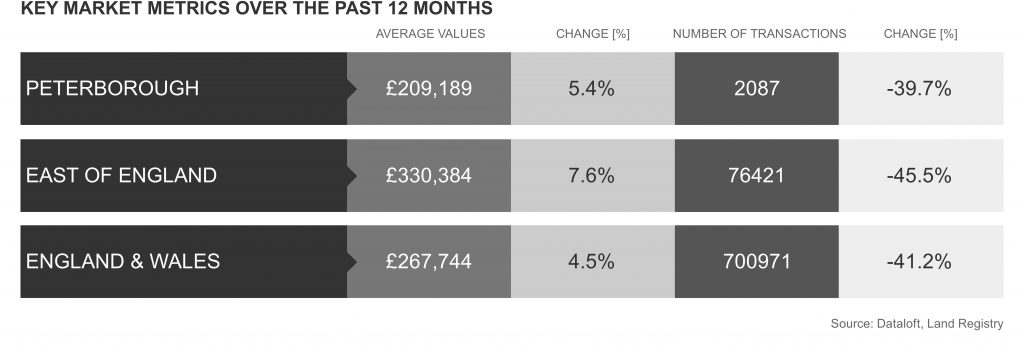
So what about our local market in Peterborough?
Bubble analysis = Mixed. We are experiencing local reductions in property prices in the last quarter of 2022 as well as a decreasing demand from buyers. The average daily views per property for Peterborough in December is currently 45 view per day (Tortoise Property 100.3 views per day). In May 2022 we experienced average daily viewing figures of 99.5 in Peterborough (Tortoise Property 332.4 views per day) which highlights the difference in demand. Also there has been 5758 sales instructions in the Greater Peterborough area this year with 3176 agreed sales. The expectation is that the agreed sales figures will reduce by 15%+ in 2023 meaning we move back to a more balanced market place where marketing and attracting the correct buyer will be important to owners that are looking to sell.
Peterborough enjoys many advantages to other Cities in the UK, being one of the top 10 Cities for growth however, we are susceptible to high rises in living costs due to our lower average salary levels and disposable income figures compared to some parts of the UK. We are, though, attractive to buyers moving northwards where access to London and its suburbs are required for work and to visit family. In 2022 alone first time buyers leaving London spent £8.35 billion pounds on property. Up to date data can be found on our Market Data page on our website https://www.tortoiseproperty.co.uk/market-data.html
Our bubble summary:
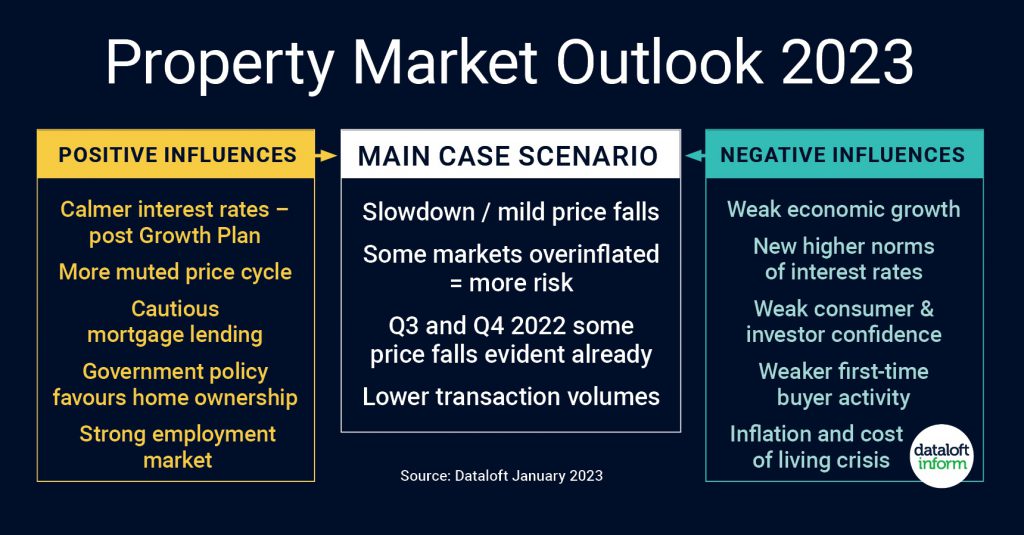
Nationally we looked at 9 areas that overall saw house prices fading into 2023. We expect the Bank of England interest rate to settle around 4% to 4.25% in the New Year due to a more controlled approach from the government. The inflation costs for consumers (including housing) stands at 9.3% (15/1/2023) which is affecting buyers ability to buy and run new homes. With these two numbers contributing to the costs of living crisis will mean we see a reduction in GDP which ultimately effects the cost of a home. Expect house prices therefore to fade rather than crash through 2023 / 24.
In Peterborough the increase in house prices has been influenced by the decrease in transactions over the previous twelves months whilst experiencing a high demand from buyers into the start of September. This has now changed with a normal number of buyers with choice going into 2023.
We continue to blow bubbles here at Tortoise Property and keep checking to see if they are on the rise, when they seem to fade and give some pointers, where possible, as to when they may burst!
So until the next time….
Fortune’s always hiding,
I’ve looked everywhere,
I’m forever blowing bubbles,
Pretty bubbles in the air.
Mike Matthews
Tortoise Property